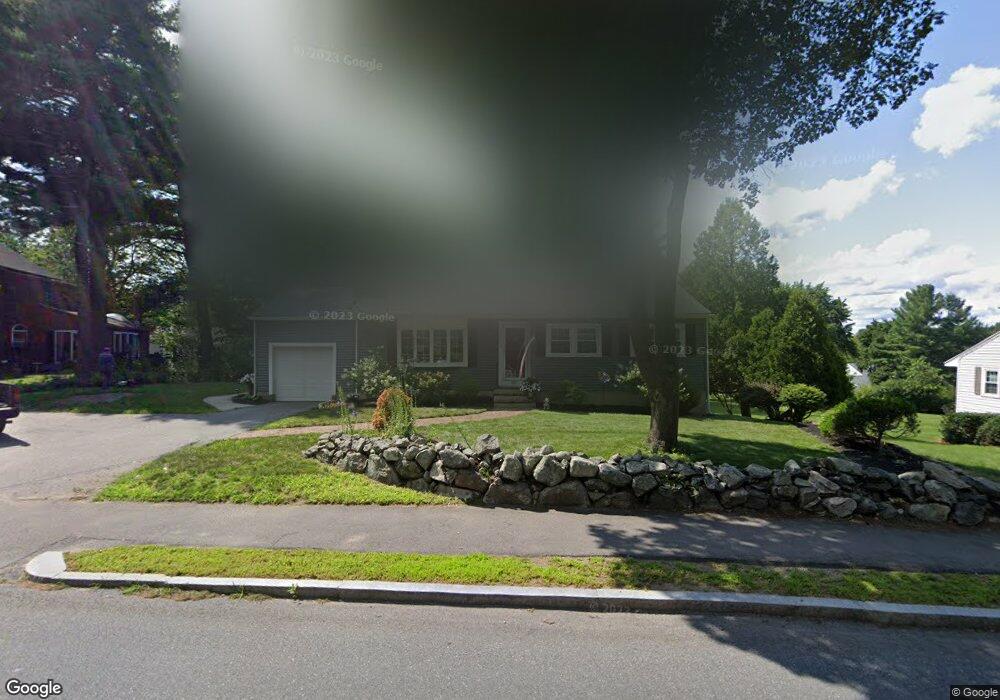
381 Franklin St Reading, MA 01867
Estimated Value: $797,000 - $914,000
2
Beds
4
Baths
1,551
Sq Ft
$544/Sq Ft
Est. Value
About This Home
This home is located at 381 Franklin St, Reading, MA 01867 and is currently estimated at $844,186, approximately $544 per square foot. 381 Franklin St is a home located in Middlesex County with nearby schools including Wood End Elementary School, Arthur W. Coolidge Middle School, and Reading Memorial High School.
Ownership History
Date
Name
Owned For
Owner Type
Purchase Details
Closed on
Jul 30, 1997
Sold by
381 Franklin St Rt and Mccarthy
Bought by
Strong Thomas J and Strong Joanne M
Current Estimated Value
Create a Home Valuation Report for This Property
The Home Valuation Report is an in-depth analysis detailing your home's value as well as a comparison with similar homes in the area
Home Values in the Area
Average Home Value in this Area
Purchase History
| Date | Buyer | Sale Price | Title Company |
|---|---|---|---|
| Strong Thomas J | $179,000 | -- |
Source: Public Records
Mortgage History
| Date | Status | Borrower | Loan Amount |
|---|---|---|---|
| Closed | Strong Thomas J | $130,000 | |
| Closed | Strong Thomas J | $150,000 | |
| Closed | Strong Thomas J | $148,220 | |
| Closed | Strong Thomas J | $40,000 |
Source: Public Records
Tax History
| Year | Tax Paid | Tax Assessment Tax Assessment Total Assessment is a certain percentage of the fair market value that is determined by local assessors to be the total taxable value of land and additions on the property. | Land | Improvement |
|---|---|---|---|---|
| 2025 | $8,824 | $774,700 | $474,100 | $300,600 |
| 2024 | $8,805 | $751,300 | $459,800 | $291,500 |
| 2023 | $8,240 | $654,500 | $400,500 | $254,000 |
| 2022 | $7,826 | $587,100 | $359,200 | $227,900 |
| 2021 | $15,407 | $551,300 | $344,800 | $206,500 |
| 2020 | $13,708 | $540,300 | $337,900 | $202,400 |
| 2019 | $0 | $514,600 | $321,800 | $192,800 |
| 2018 | $3,847 | $480,700 | $300,600 | $180,100 |
| 2017 | $0 | $459,600 | $287,400 | $172,200 |
| 2016 | $6,225 | $429,300 | $273,600 | $155,700 |
| 2015 | $5,831 | $396,700 | $252,800 | $143,900 |
| 2014 | $5,650 | $383,300 | $244,200 | $139,100 |
Source: Public Records
Map
Nearby Homes
- 119 Van Norden Rd
- 43 Ashley Place
- 68 Sanborn Ln
- 50 Forest St
- 16 Briarwood Ave
- 99 Grove St
- 32 Granger Ave
- 11 Clover Cir Unit A
- 44 Grandview Rd
- 27 Audubon Rd
- 28 Nutter Rd
- 42 Main St Unit 22
- 36 Main St Unit 1
- 0 Charles St Unit 72374573
- 141 Belmont St
- 584 Woburn St
- 17 Courtyard Place Unit 17
- 18 Symonds Way
- 2 Inwood Dr Unit 1005
- 41 Marcus Rd
Your Personal Tour Guide
Ask me questions while you tour the home.