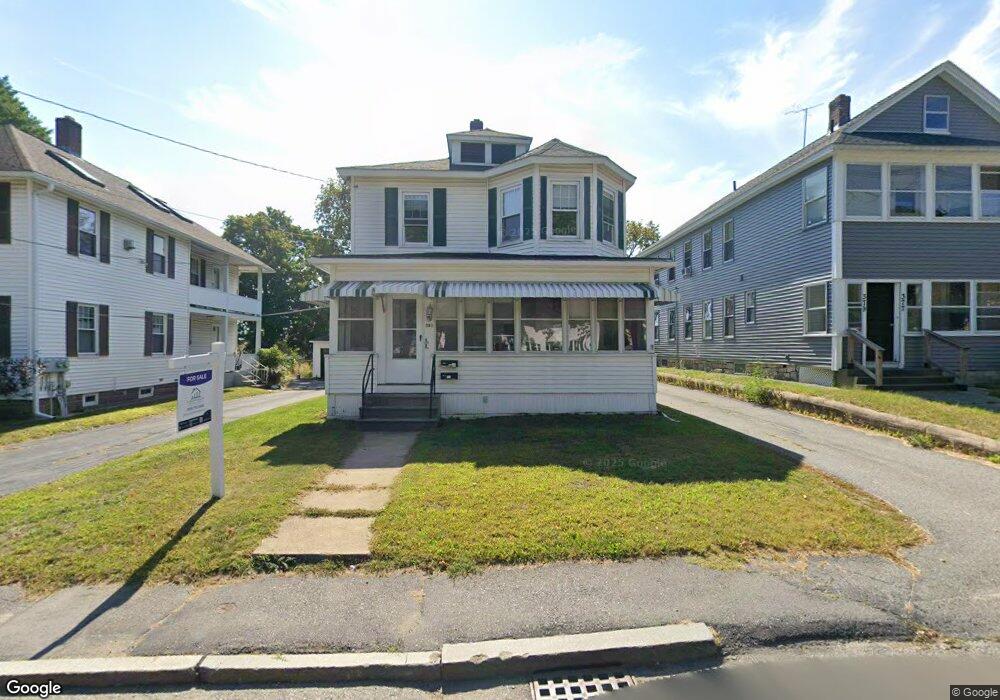
381 Main St Unit 2 Leominster, MA 01453
Estimated Value: $520,000 - $568,000
2
Beds
1
Bath
1,007
Sq Ft
$535/Sq Ft
Est. Value
About This Home
This home is located at 381 Main St Unit 2, Leominster, MA 01453 and is currently estimated at $538,392, approximately $534 per square foot. 381 Main St Unit 2 is a home located in Worcester County with nearby schools including Leominster High School, St. Leo School, and St. Anna Catholic School.
Ownership History
Date
Name
Owned For
Owner Type
Purchase Details
Closed on
Sep 30, 2019
Sold by
Marchese John and Goh-Marchese Suyoong
Bought by
Marchese Investment Llc
Current Estimated Value
Home Financials for this Owner
Home Financials are based on the most recent Mortgage that was taken out on this home.
Original Mortgage
$210,000
Outstanding Balance
$183,971
Interest Rate
3.5%
Mortgage Type
Commercial
Estimated Equity
$354,421
Purchase Details
Closed on
Aug 27, 2019
Sold by
Us Bank Na Tr
Bought by
Marchese John and Goh-Marchese Suyoong
Home Financials for this Owner
Home Financials are based on the most recent Mortgage that was taken out on this home.
Original Mortgage
$210,000
Outstanding Balance
$183,971
Interest Rate
3.5%
Mortgage Type
Commercial
Estimated Equity
$354,421
Purchase Details
Closed on
Jun 1, 2017
Sold by
Duval Richard W
Bought by
Us Bank Na Tr
Create a Home Valuation Report for This Property
The Home Valuation Report is an in-depth analysis detailing your home's value as well as a comparison with similar homes in the area
Home Values in the Area
Average Home Value in this Area
Purchase History
| Date | Buyer | Sale Price | Title Company |
|---|---|---|---|
| Marchese Investment Llc | -- | -- | |
| Marchese John | $225,000 | -- | |
| Us Bank Na Tr | $218,800 | -- |
Source: Public Records
Mortgage History
| Date | Status | Borrower | Loan Amount |
|---|---|---|---|
| Open | Marchese Investment Llc | $210,000 | |
| Closed | Marchese John | $210,000 |
Source: Public Records
Tax History Compared to Growth
Tax History
| Year | Tax Paid | Tax Assessment Tax Assessment Total Assessment is a certain percentage of the fair market value that is determined by local assessors to be the total taxable value of land and additions on the property. | Land | Improvement |
|---|---|---|---|---|
| 2025 | $5,594 | $398,700 | $111,200 | $287,500 |
| 2024 | $5,173 | $356,500 | $105,900 | $250,600 |
| 2023 | $4,925 | $316,900 | $92,100 | $224,800 |
| 2022 | $4,682 | $282,700 | $80,000 | $202,700 |
| 2021 | $4,404 | $242,900 | $62,300 | $180,600 |
| 2020 | $4,599 | $255,800 | $62,300 | $193,500 |
| 2019 | $4,173 | $225,100 | $59,300 | $165,800 |
| 2018 | $4,052 | $209,600 | $57,600 | $152,000 |
| 2017 | $3,346 | $169,600 | $53,800 | $115,800 |
| 2016 | $3,184 | $162,600 | $53,800 | $108,800 |
| 2015 | $2,998 | $154,200 | $53,800 | $100,400 |
| 2014 | $2,998 | $158,700 | $58,900 | $99,800 |
Source: Public Records
Map
Nearby Homes