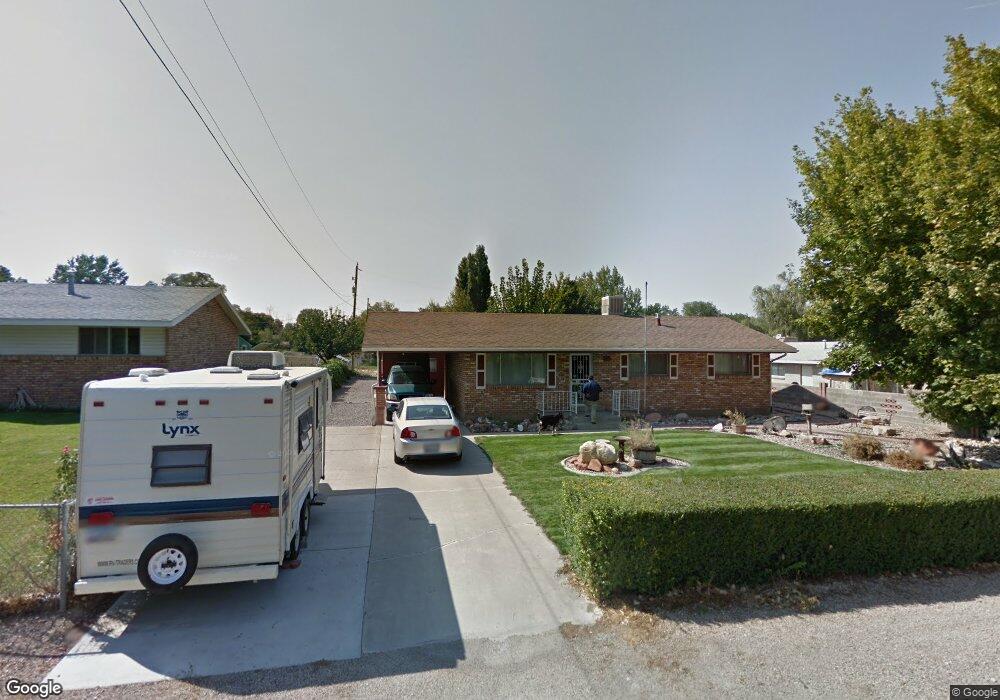
381 N 400 E Santaquin, UT 84655
Estimated Value: $457,000 - $485,000
4
Beds
2
Baths
2,340
Sq Ft
$203/Sq Ft
Est. Value
About This Home
This home is located at 381 N 400 E, Santaquin, UT 84655 and is currently estimated at $473,974, approximately $202 per square foot. 381 N 400 E is a home located in Utah County with nearby schools including Apple Valley Elementary, Payson Junior High School, and Mt. Nebo Middle.
Ownership History
Date
Name
Owned For
Owner Type
Purchase Details
Closed on
Dec 3, 2019
Sold by
Ted L Jones Trust
Bought by
Lambertsen Phil and Lambertsen Stacey
Current Estimated Value
Purchase Details
Closed on
Oct 17, 2019
Sold by
Tdjo Llc
Bought by
Jones Ted L and Ted L Jones Trust
Purchase Details
Closed on
Sep 3, 2019
Sold by
Jones Ted L
Bought by
Jones Ted L and Ted L Jones Trust
Purchase Details
Closed on
Oct 9, 2009
Sold by
Jones Ted Lee
Bought by
Tdjo Llc
Purchase Details
Closed on
Mar 16, 2006
Sold by
Jones Ted Lee and Jones Donetta Joy
Bought by
Jones Ted L and Jones Donetta J
Create a Home Valuation Report for This Property
The Home Valuation Report is an in-depth analysis detailing your home's value as well as a comparison with similar homes in the area
Home Values in the Area
Average Home Value in this Area
Purchase History
| Date | Buyer | Sale Price | Title Company |
|---|---|---|---|
| Lambertsen Phil | -- | Bartlett Title | |
| Jones Ted L | -- | None Available | |
| Jones Ted L | -- | None Available | |
| Jones Ted L | -- | None Available | |
| Tdjo Llc | -- | None Available | |
| Jones Ted L | -- | None Available |
Source: Public Records
Tax History
| Year | Tax Paid | Tax Assessment Tax Assessment Total Assessment is a certain percentage of the fair market value that is determined by local assessors to be the total taxable value of land and additions on the property. | Land | Improvement |
|---|---|---|---|---|
| 2025 | $2,150 | $244,310 | -- | -- |
| 2024 | $2,184 | $214,115 | $0 | $0 |
| 2023 | $2,245 | $218,185 | $0 | $0 |
| 2022 | $2,245 | $231,330 | $0 | $0 |
| 2021 | $1,923 | $307,100 | $78,800 | $228,300 |
| 2020 | $1,841 | $284,900 | $68,500 | $216,400 |
| 2019 | $1,643 | $260,100 | $64,700 | $195,400 |
| 2018 | $1,529 | $230,800 | $60,900 | $169,900 |
| 2017 | $1,453 | $117,150 | $0 | $0 |
| 2016 | $1,377 | $108,790 | $0 | $0 |
| 2015 | $1,253 | $97,075 | $0 | $0 |
| 2014 | $1,126 | $87,120 | $0 | $0 |
Source: Public Records
Map
Nearby Homes
- 136 N 200 E
- 42 E 400 N
- 600 N Center St
- 341 E 100 S
- 49 S 100 E
- 152 E 840 N Unit 16
- 873 N 200 E Unit 36
- 842 N 160 E
- 842 N 160 E Unit 17
- 78 N Peach St
- 41 W 770 N
- 202 N Oh Henry St
- 97 N Oh Henry St
- 902 N 160 E
- 902 N 160 E Unit 19
- 169 W 690 N
- 225 W 500 North St
- 923 N 200 E Unit 33
- 933 N 200 E
- 933 N 200 E Unit 32
Your Personal Tour Guide
Ask me questions while you tour the home.