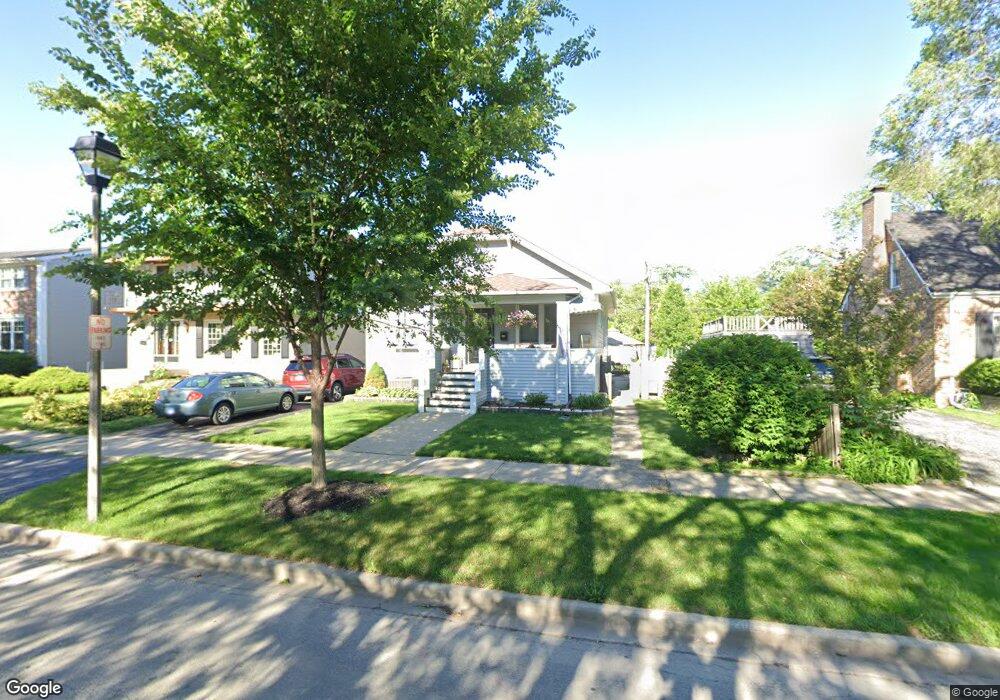
381 N Emroy Ave Elmhurst, IL 60126
Estimated Value: $454,000 - $590,000
Studio
--
Bath
1,064
Sq Ft
$488/Sq Ft
Est. Value
About This Home
This home is located at 381 N Emroy Ave, Elmhurst, IL 60126 and is currently estimated at $518,750, approximately $487 per square foot. 381 N Emroy Ave is a home located in DuPage County with nearby schools including Field Elementary School, Sandburg Middle School, and York Community High School.
Ownership History
Date
Name
Owned For
Owner Type
Purchase Details
Closed on
Nov 19, 1999
Sold by
Walker Michael A and Walker Marie T
Bought by
Sasanelli Nick and Sasanelli Susan M
Current Estimated Value
Home Financials for this Owner
Home Financials are based on the most recent Mortgage that was taken out on this home.
Original Mortgage
$185,430
Outstanding Balance
$57,173
Interest Rate
7.88%
Mortgage Type
FHA
Estimated Equity
$461,577
Purchase Details
Closed on
Jun 6, 1996
Sold by
Orrico Daniel C and Orrico Genevieve
Bought by
Walker Michael A and Walker Marie T
Home Financials for this Owner
Home Financials are based on the most recent Mortgage that was taken out on this home.
Original Mortgage
$165,830
Interest Rate
8.29%
Mortgage Type
VA
Create a Home Valuation Report for This Property
The Home Valuation Report is an in-depth analysis detailing your home's value as well as a comparison with similar homes in the area
Home Values in the Area
Average Home Value in this Area
Purchase History
| Date | Buyer | Sale Price | Title Company |
|---|---|---|---|
| Sasanelli Nick | $187,000 | -- | |
| Walker Michael A | $161,000 | -- |
Source: Public Records
Mortgage History
| Date | Status | Borrower | Loan Amount |
|---|---|---|---|
| Open | Sasanelli Nick | $185,430 | |
| Previous Owner | Walker Michael A | $165,830 |
Source: Public Records
Tax History
| Year | Tax Paid | Tax Assessment Tax Assessment Total Assessment is a certain percentage of the fair market value that is determined by local assessors to be the total taxable value of land and additions on the property. | Land | Improvement |
|---|---|---|---|---|
| 2024 | $7,436 | $129,427 | $70,816 | $58,611 |
| 2023 | $6,849 | $118,980 | $65,100 | $53,880 |
| 2022 | $6,609 | $113,890 | $62,300 | $51,590 |
| 2021 | $6,323 | $109,090 | $59,670 | $49,420 |
| 2020 | $5,946 | $104,490 | $57,150 | $47,340 |
| 2019 | $5,882 | $100,470 | $54,950 | $45,520 |
| 2018 | $5,508 | $93,950 | $52,340 | $41,610 |
| 2017 | $5,396 | $89,790 | $50,020 | $39,770 |
| 2016 | $5,161 | $82,900 | $46,180 | $36,720 |
| 2015 | $5,051 | $76,580 | $42,660 | $33,920 |
| 2014 | $4,711 | $66,510 | $35,200 | $31,310 |
| 2013 | $4,695 | $67,870 | $35,920 | $31,950 |
Source: Public Records
Map
Nearby Homes
- 234 E Grantley Ave
- 272 N Willow Rd
- 183 E Grantley Ave
- 286 N Indiana St
- 516 N Emroy Ave
- 219 N Clinton Ave
- 238 N Geneva Ave
- 220 N Geneva Ave
- 175 N Berteau Ave
- 209 N Maison Ct
- 260 N Addison Ave
- 256 N Addison Ave
- 258 N Addison Ave
- 254 N Addison Ave
- 195 N Addison Ave Unit PH03
- 110 N Willow Rd
- 142 W 3rd St
- 210 N Addison Ave Unit 301N
- 444 E Schiller St
- 132 E Gladys Ave
- 387 N Emroy Ave
- 375 N Emroy Ave
- 391 N Emroy Ave
- 393 N Emroy Ave
- 382 N Adele St
- 280 E Grantley Ave
- 378 N Adele St
- 365 N Emroy Ave
- 392 N Adele St
- 392 N Adele St
- 363 N Emroy Ave
- 276 E Grantley Ave
- 374 N Adele St
- 279 E Grantley Ave
- 370 N Adele St
- 396 N Adele St
- 361 N Emroy Ave
- 270 E Grantley Ave
- 277 E Grantley Ave
- 366 N Adele St
Your Personal Tour Guide
Ask me questions while you tour the home.