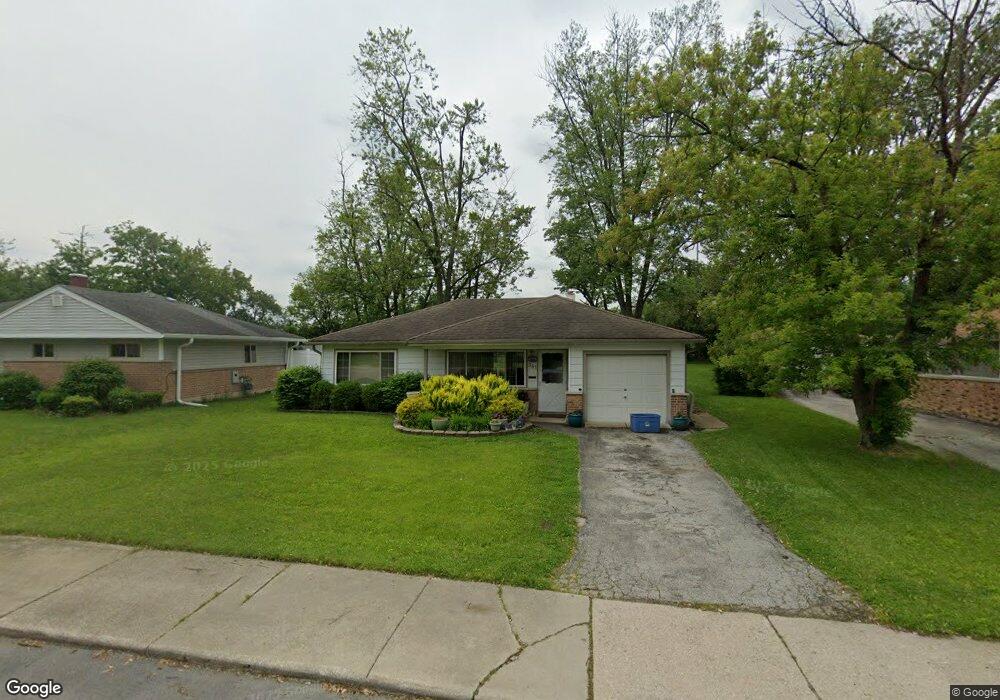
381 Oswego St Park Forest, IL 60466
Estimated Value: $122,000 - $154,000
2
Beds
1
Bath
939
Sq Ft
$146/Sq Ft
Est. Value
About This Home
This home is located at 381 Oswego St, Park Forest, IL 60466 and is currently estimated at $137,058, approximately $145 per square foot. 381 Oswego St is a home located in Cook County with nearby schools including Blackhawk Intermediate Center, 21st Century Primary Center, and Michelle Obama School of Technology.
Ownership History
Date
Name
Owned For
Owner Type
Purchase Details
Closed on
Jul 26, 2005
Sold by
Strobel Timothy W and Portiera Joseph R
Bought by
Trejo Eusebia
Current Estimated Value
Home Financials for this Owner
Home Financials are based on the most recent Mortgage that was taken out on this home.
Original Mortgage
$77,600
Outstanding Balance
$40,974
Interest Rate
5.74%
Mortgage Type
Fannie Mae Freddie Mac
Estimated Equity
$96,084
Purchase Details
Closed on
Jan 10, 2003
Sold by
Hud
Bought by
Strobel Timothy W and Portiera Joseph R
Purchase Details
Closed on
May 10, 2002
Sold by
Clinton
Bought by
Hud
Purchase Details
Closed on
Aug 18, 1997
Sold by
Clinton Orin
Bought by
Clinton Orin and Clinton Carolyn
Purchase Details
Closed on
Apr 25, 1997
Sold by
Seanor William K
Bought by
Clinton Orin
Home Financials for this Owner
Home Financials are based on the most recent Mortgage that was taken out on this home.
Original Mortgage
$67,842
Interest Rate
8.05%
Mortgage Type
FHA
Create a Home Valuation Report for This Property
The Home Valuation Report is an in-depth analysis detailing your home's value as well as a comparison with similar homes in the area
Home Values in the Area
Average Home Value in this Area
Purchase History
| Date | Buyer | Sale Price | Title Company |
|---|---|---|---|
| Trejo Eusebia | $97,000 | Preferred Title Ins Agency | |
| Strobel Timothy W | -- | Preferred Title Ins Agency | |
| Hud | -- | -- | |
| Clinton Orin | -- | -- | |
| Clinton Orin | $68,000 | -- |
Source: Public Records
Mortgage History
| Date | Status | Borrower | Loan Amount |
|---|---|---|---|
| Open | Trejo Eusebia | $77,600 | |
| Previous Owner | Clinton Orin | $67,842 |
Source: Public Records
Tax History Compared to Growth
Tax History
| Year | Tax Paid | Tax Assessment Tax Assessment Total Assessment is a certain percentage of the fair market value that is determined by local assessors to be the total taxable value of land and additions on the property. | Land | Improvement |
|---|---|---|---|---|
| 2024 | -- | $11,000 | $2,721 | $8,279 |
| 2023 | -- | $11,000 | $2,721 | $8,279 |
| 2022 | $0 | $3,463 | $2,527 | $936 |
| 2021 | $1,696 | $3,462 | $2,526 | $936 |
| 2020 | $1,696 | $3,462 | $2,526 | $936 |
| 2019 | $1,696 | $5,664 | $2,332 | $3,332 |
| 2018 | $0 | $5,664 | $2,332 | $3,332 |
| 2017 | $933 | $5,664 | $2,332 | $3,332 |
| 2016 | $1,696 | $6,158 | $2,137 | $4,021 |
| 2015 | $5,983 | $6,158 | $2,137 | $4,021 |
| 2014 | -- | $6,158 | $2,137 | $4,021 |
| 2013 | $1,587 | $6,386 | $2,137 | $4,249 |
Source: Public Records
Map
Nearby Homes
- 366 Oswego St
- 357 Niagara St
- 348 Niagara St
- 358 Niagara St
- 340 Nassau St
- 332 Nokomis St
- 365 Oswego St
- 357 Neola St
- 337 Nassau St
- 106 Blackhawk Dr
- 127 Blackhawk Dr
- 326 Nassau St
- 343 Indianwood Blvd
- 322 Nokomis St
- 329 Indianwood Blvd
- 337 S Orchard Dr
- 355 Oswego St
- 363 Indianwood Blvd
- 101 Shabbona Dr
- 103 Shabbona Dr