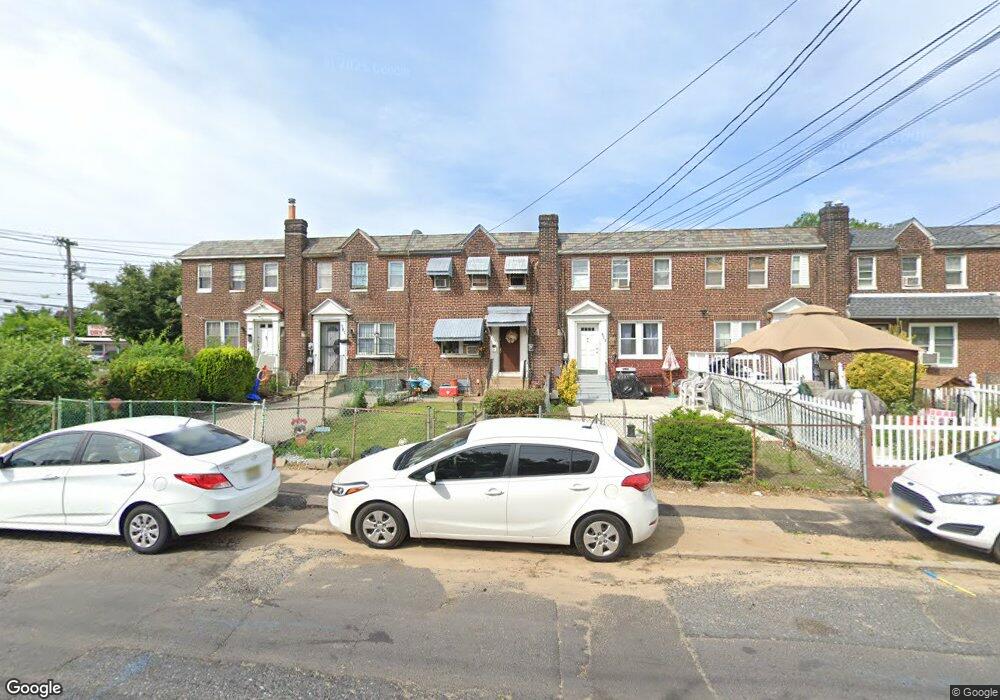
381 S 27th St Camden, NJ 08105
Marlton NeighborhoodEstimated Value: $113,687 - $203,000
3
Beds
1
Bath
1,152
Sq Ft
$135/Sq Ft
Est. Value
About This Home
This home is located at 381 S 27th St, Camden, NJ 08105 and is currently estimated at $155,422, approximately $134 per square foot. 381 S 27th St is a home located in Camden County with nearby schools including Alfred Cramer College Preparatory Lab School, Eastside High School, and St Joseph Pro-Cathedral School.
Ownership History
Date
Name
Owned For
Owner Type
Purchase Details
Closed on
Feb 27, 2023
Sold by
Florentino Angela E
Bought by
Cepeda Sinecia
Current Estimated Value
Purchase Details
Closed on
Jan 29, 2020
Sold by
Santos Meyri De Los
Bought by
Florentino Angela E
Purchase Details
Closed on
Aug 10, 2017
Sold by
Cepeda Beatriz
Bought by
Sontos Meyri De Los
Purchase Details
Closed on
Apr 14, 1999
Sold by
Reyes Norma I
Bought by
Rivera Sinecia
Purchase Details
Closed on
Jun 13, 1997
Sold by
Federal Housing Administration
Bought by
Reyes Norma Y
Create a Home Valuation Report for This Property
The Home Valuation Report is an in-depth analysis detailing your home's value as well as a comparison with similar homes in the area
Home Values in the Area
Average Home Value in this Area
Purchase History
| Date | Buyer | Sale Price | Title Company |
|---|---|---|---|
| Cepeda Sinecia | -- | -- | |
| Florentino Angela E | -- | City Abstract | |
| Sontos Meyri De Los | -- | None Available | |
| Rivera Sinecia | $16,000 | -- | |
| Reyes Norma Y | $13,057 | -- |
Source: Public Records
Tax History Compared to Growth
Tax History
| Year | Tax Paid | Tax Assessment Tax Assessment Total Assessment is a certain percentage of the fair market value that is determined by local assessors to be the total taxable value of land and additions on the property. | Land | Improvement |
|---|---|---|---|---|
| 2025 | $1,485 | $41,900 | $16,400 | $25,500 |
| 2024 | $1,435 | $41,900 | $16,400 | $25,500 |
| 2023 | $1,435 | $41,900 | $16,400 | $25,500 |
| 2022 | $1,408 | $41,900 | $16,400 | $25,500 |
| 2021 | $1,403 | $41,900 | $16,400 | $25,500 |
| 2020 | $1,332 | $41,900 | $16,400 | $25,500 |
| 2019 | $1,276 | $41,900 | $16,400 | $25,500 |
| 2018 | $1,269 | $41,900 | $16,400 | $25,500 |
| 2017 | $1,238 | $41,900 | $16,400 | $25,500 |
| 2016 | $1,199 | $41,900 | $16,400 | $25,500 |
| 2015 | $1,154 | $41,900 | $16,400 | $25,500 |
| 2014 | $1,126 | $41,900 | $16,400 | $25,500 |
Source: Public Records
Map
Nearby Homes
- 355 S 27th St
- 2933 Royden St
- 402 S 30th St
- 3001 Royden St
- 341 Marlton Ave
- 420 Boyd St
- 363 Garden Ave
- 520 Beacon Ave
- 154 Eutaw Ave
- 7130 Rosemont Ave
- 6861 Clark Ave
- 477 Rand St
- 555 Pfeiffer St
- 608 Raritan St
- 506 Pfeiffer St
- 6709 Chandler Ave
- 603 Raritan St
- 444 Pfeiffer St
- 2598 Baird Blvd
- 7186 Waldorf Ave