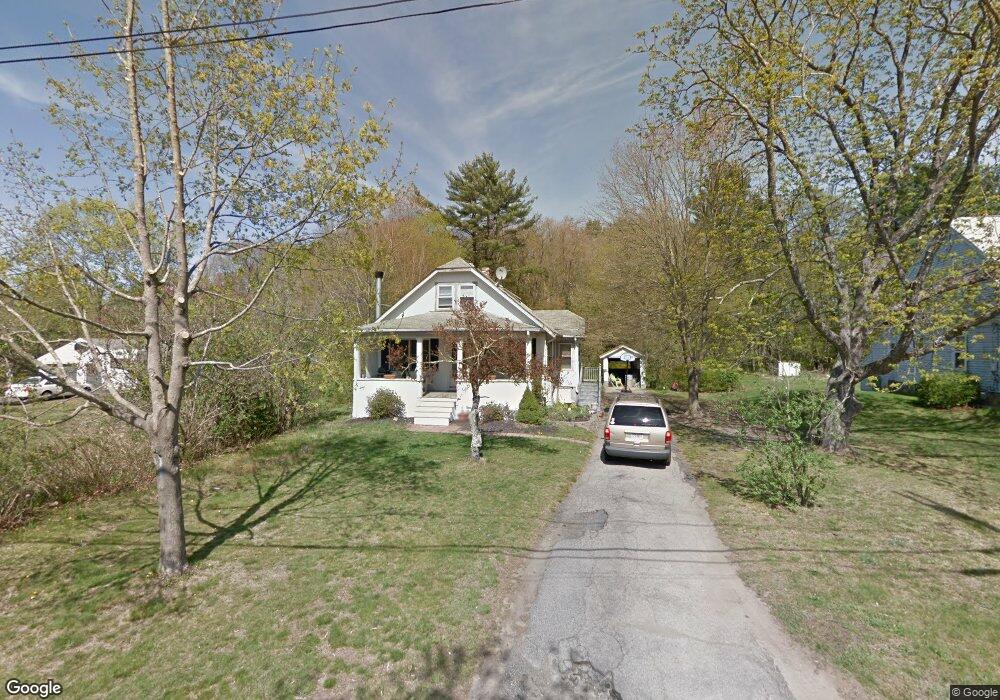
381 Spring St West Bridgewater, MA 02379
Estimated Value: $528,000 - $639,000
3
Beds
3
Baths
1,807
Sq Ft
$334/Sq Ft
Est. Value
About This Home
This home is located at 381 Spring St, West Bridgewater, MA 02379 and is currently estimated at $604,300, approximately $334 per square foot. 381 Spring St is a home located in Plymouth County with nearby schools including Spring Street Elementary School, Rose L. MacDonald Elementary School, and Howard Elementary School.
Ownership History
Date
Name
Owned For
Owner Type
Purchase Details
Closed on
Aug 29, 2000
Sold by
Delosh Christopher and Delosh Patricia E
Bought by
Quinn Richard D and Quinn Kathleen M
Current Estimated Value
Purchase Details
Closed on
Oct 30, 1992
Sold by
Mcmahon Maureen T
Bought by
Delosh Christopher and Delosh Patricia E
Create a Home Valuation Report for This Property
The Home Valuation Report is an in-depth analysis detailing your home's value as well as a comparison with similar homes in the area
Home Values in the Area
Average Home Value in this Area
Purchase History
| Date | Buyer | Sale Price | Title Company |
|---|---|---|---|
| Quinn Richard D | $165,000 | -- | |
| Delosh Christopher | $115,000 | -- |
Source: Public Records
Mortgage History
| Date | Status | Borrower | Loan Amount |
|---|---|---|---|
| Open | Delosh Christopher | $208,000 | |
| Closed | Delosh Christopher | $20,000 | |
| Closed | Delosh Christopher | $180,000 |
Source: Public Records
Tax History
| Year | Tax Paid | Tax Assessment Tax Assessment Total Assessment is a certain percentage of the fair market value that is determined by local assessors to be the total taxable value of land and additions on the property. | Land | Improvement |
|---|---|---|---|---|
| 2025 | $7,498 | $548,500 | $200,900 | $347,600 |
| 2024 | $6,922 | $488,500 | $182,100 | $306,400 |
| 2023 | $6,757 | $439,600 | $157,700 | $281,900 |
| 2022 | $6,297 | $388,200 | $148,300 | $239,900 |
| 2021 | $6,198 | $370,900 | $148,300 | $222,600 |
| 2020 | $6,070 | $370,800 | $148,300 | $222,500 |
| 2019 | $6,058 | $366,500 | $148,300 | $218,200 |
| 2018 | $5,284 | $348,100 | $140,800 | $207,300 |
| 2017 | $3,603 | $203,200 | $127,700 | $75,500 |
| 2016 | $3,496 | $194,200 | $118,700 | $75,500 |
| 2015 | $3,409 | $191,400 | $118,700 | $72,700 |
| 2014 | $3,156 | $191,400 | $118,700 | $72,700 |
Source: Public Records
Map
Nearby Homes
- 19 Progressive Ave
- 22 Grant St
- Lot 1 Jeffrey Ln
- Lots 1-4 Copeland St
- 93 Prospect St
- 12 Finny's Way
- 10 Charles St
- 16 Jason Way
- 86 Hayward Ave
- 41 Victorian Way
- 18 American Ave
- 1845 Main St
- 16 Liberty St
- 31 Friendship Dr
- 9 Longworth Ave Unit 135
- 9 Longworth Ave Unit 132
- 47 Southworth St
- 92 Bryant St
- 35 Longworth Ave Unit 25
- 603 W Chestnut St
Your Personal Tour Guide
Ask me questions while you tour the home.