Estimated Value: $130,251 - $162,000
2
Beds
1
Bath
756
Sq Ft
$193/Sq Ft
Est. Value
About This Home
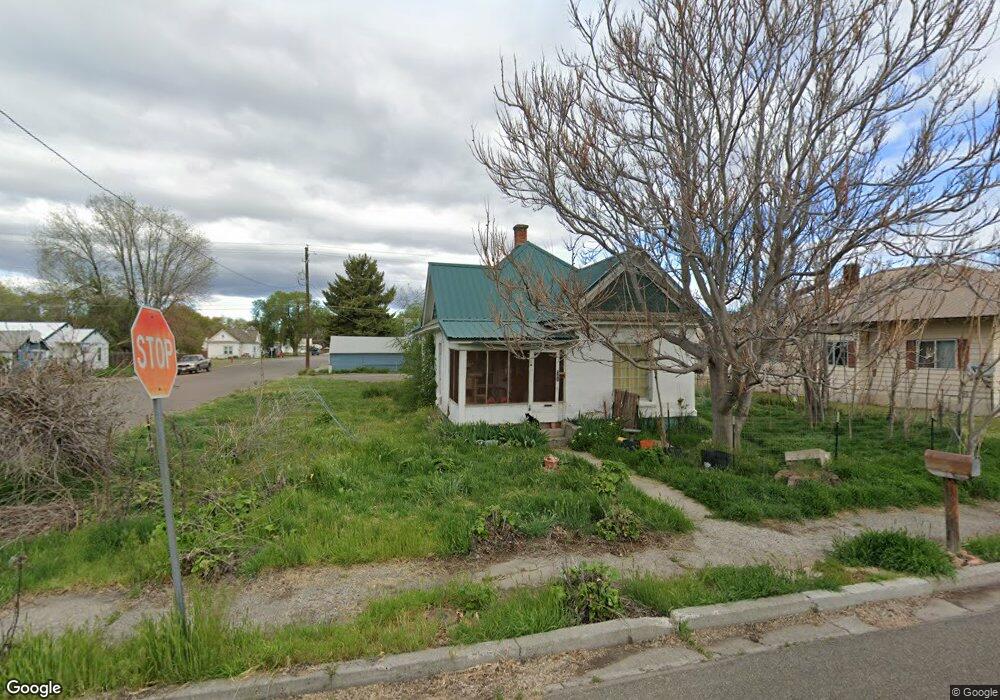
This home is located at 381 West St S, Vale, OR 97918 and is currently estimated at $146,126, approximately $193 per square foot. 381 West St S is a home located in Malheur County with nearby schools including Vale Middle School, Vale High School, and Mount Moriah Christian Academy.
Ownership History
Date
Name
Owned For
Owner Type
Purchase Details
Closed on
Dec 10, 2019
Sold by
Andrews Dan and Andrews Lana
Bought by
Gannon Jenny Louise
Current Estimated Value
Home Financials for this Owner
Home Financials are based on the most recent Mortgage that was taken out on this home.
Original Mortgage
$45,000
Outstanding Balance
$37,722
Interest Rate
3.7%
Mortgage Type
Seller Take Back
Estimated Equity
$108,404
Purchase Details
Closed on
Apr 29, 2005
Sold by
Miles Phyllis M
Bought by
Andrews Dan and Andrews Lana
Home Financials for this Owner
Home Financials are based on the most recent Mortgage that was taken out on this home.
Original Mortgage
$22,000
Interest Rate
5.92%
Mortgage Type
Purchase Money Mortgage
Create a Home Valuation Report for This Property
The Home Valuation Report is an in-depth analysis detailing your home's value as well as a comparison with similar homes in the area
Purchase History
| Date | Buyer | Sale Price | Title Company |
|---|---|---|---|
| Gannon Jenny Louise | $50,000 | Malheur County Title Co Inc | |
| Andrews Dan | $22,000 | -- |
Source: Public Records
Mortgage History
| Date | Status | Borrower | Loan Amount |
|---|---|---|---|
| Open | Gannon Jenny Louise | $45,000 | |
| Previous Owner | Andrews Dan | $22,000 |
Source: Public Records
Tax History
| Year | Tax Paid | Tax Assessment Tax Assessment Total Assessment is a certain percentage of the fair market value that is determined by local assessors to be the total taxable value of land and additions on the property. | Land | Improvement |
|---|---|---|---|---|
| 2025 | $621 | $33,645 | $11,382 | $22,263 |
| 2024 | $607 | $32,666 | $11,051 | $21,615 |
| 2023 | $588 | $31,715 | $11,416 | $20,299 |
| 2022 | $572 | $30,792 | $13,401 | $17,391 |
| 2021 | $572 | $29,896 | $14,108 | $15,788 |
| 2020 | $543 | $29,026 | $11,922 | $17,104 |
| 2019 | $530 | $28,181 | $12,167 | $16,014 |
| 2018 | $517 | $27,361 | $11,879 | $15,482 |
| 2017 | $498 | $26,565 | $11,726 | $14,839 |
| 2016 | $473 | $25,792 | $11,385 | $14,407 |
| 2015 | $468 | $25,041 | $10,930 | $14,111 |
| 2014 | $456 | $24,312 | $11,149 | $13,163 |
Source: Public Records
Map
Nearby Homes
Your Personal Tour Guide
Ask me questions while you tour the home.