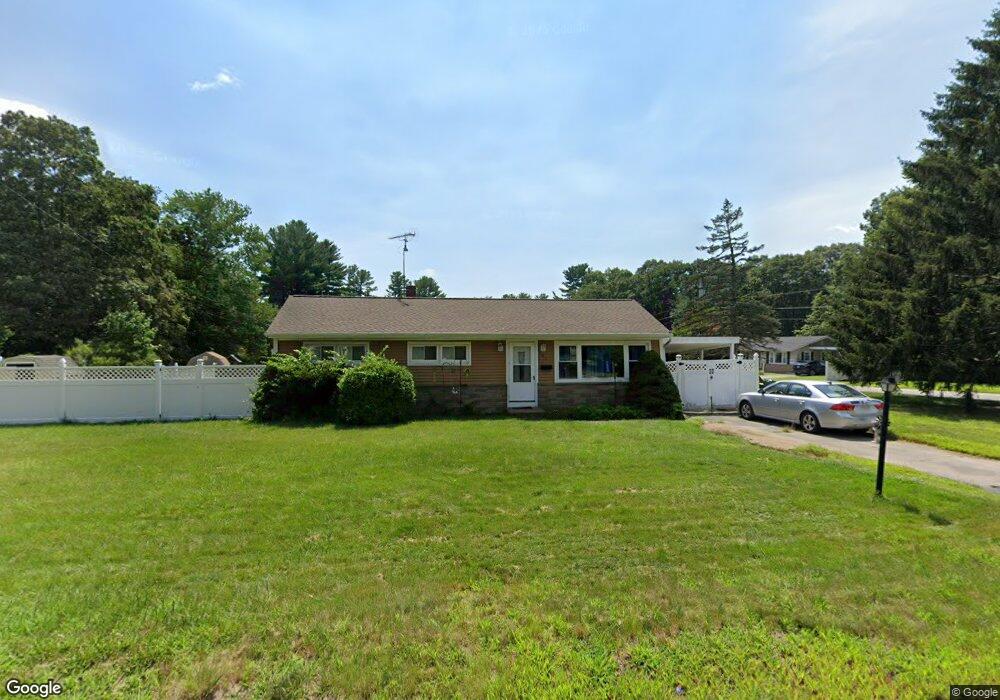
381 Wrentham Rd Bellingham, MA 02019
Estimated Value: $451,000 - $517,000
3
Beds
1
Bath
2,288
Sq Ft
$207/Sq Ft
Est. Value
About This Home
This home is located at 381 Wrentham Rd, Bellingham, MA 02019 and is currently estimated at $474,034, approximately $207 per square foot. 381 Wrentham Rd is a home located in Norfolk County with nearby schools including Joseph F. DiPietro Elementary, Bellingham High School, and Rise Prep Mayoral Academy Middle School.
Ownership History
Date
Name
Owned For
Owner Type
Purchase Details
Closed on
Aug 17, 2010
Sold by
Fontenarosa Carolyn C and Genereux Nancy L
Bought by
Cardoso Nina and Riley Mark R
Current Estimated Value
Home Financials for this Owner
Home Financials are based on the most recent Mortgage that was taken out on this home.
Original Mortgage
$178,000
Outstanding Balance
$118,209
Interest Rate
4.63%
Mortgage Type
Purchase Money Mortgage
Estimated Equity
$355,825
Purchase Details
Closed on
Oct 5, 2007
Sold by
Fontenarosa Ft and Fontenarosa
Bought by
Genereaux Nancy L
Create a Home Valuation Report for This Property
The Home Valuation Report is an in-depth analysis detailing your home's value as well as a comparison with similar homes in the area
Home Values in the Area
Average Home Value in this Area
Purchase History
| Date | Buyer | Sale Price | Title Company |
|---|---|---|---|
| Cardoso Nina | $222,500 | -- | |
| Genereaux Nancy L | -- | -- |
Source: Public Records
Mortgage History
| Date | Status | Borrower | Loan Amount |
|---|---|---|---|
| Open | Cardoso Nina | $178,000 |
Source: Public Records
Tax History Compared to Growth
Tax History
| Year | Tax Paid | Tax Assessment Tax Assessment Total Assessment is a certain percentage of the fair market value that is determined by local assessors to be the total taxable value of land and additions on the property. | Land | Improvement |
|---|---|---|---|---|
| 2025 | $4,149 | $330,300 | $131,500 | $198,800 |
| 2024 | $3,984 | $309,800 | $120,000 | $189,800 |
| 2023 | $3,841 | $294,300 | $114,300 | $180,000 |
| 2022 | $3,758 | $266,900 | $95,300 | $171,600 |
| 2021 | $3,636 | $252,300 | $95,300 | $157,000 |
| 2020 | $3,342 | $235,000 | $95,300 | $139,700 |
| 2019 | $3,265 | $229,800 | $95,300 | $134,500 |
| 2018 | $3,075 | $213,400 | $96,200 | $117,200 |
| 2017 | $3,007 | $209,700 | $96,200 | $113,500 |
| 2016 | $2,935 | $205,400 | $100,000 | $105,400 |
| 2015 | $2,816 | $197,600 | $96,200 | $101,400 |
| 2014 | $2,804 | $191,300 | $92,800 | $98,500 |
Source: Public Records
Map
Nearby Homes
- 340 Wrentham Rd
- 29 Squire Ln
- 24 Palmetto Dr Unit 24
- 21 Palmetto Dr Unit 21
- 124 Lake St
- 65 Palmetto Dr Unit 65
- 9 Pebble Cir Unit 9
- 219 Dawn Blvd
- 1250 Pulaski Blvd
- 444 Knollwood Dr
- 21 Irving St
- 202 Paine St
- 194 Paine St
- 10 Stoneham Dr
- 540 Pulaski Blvd
- 91 Moody St
- 2 Duhamel Way
- 56 Arland Ct
- 20 Cooks Ln
- 30 Oak St