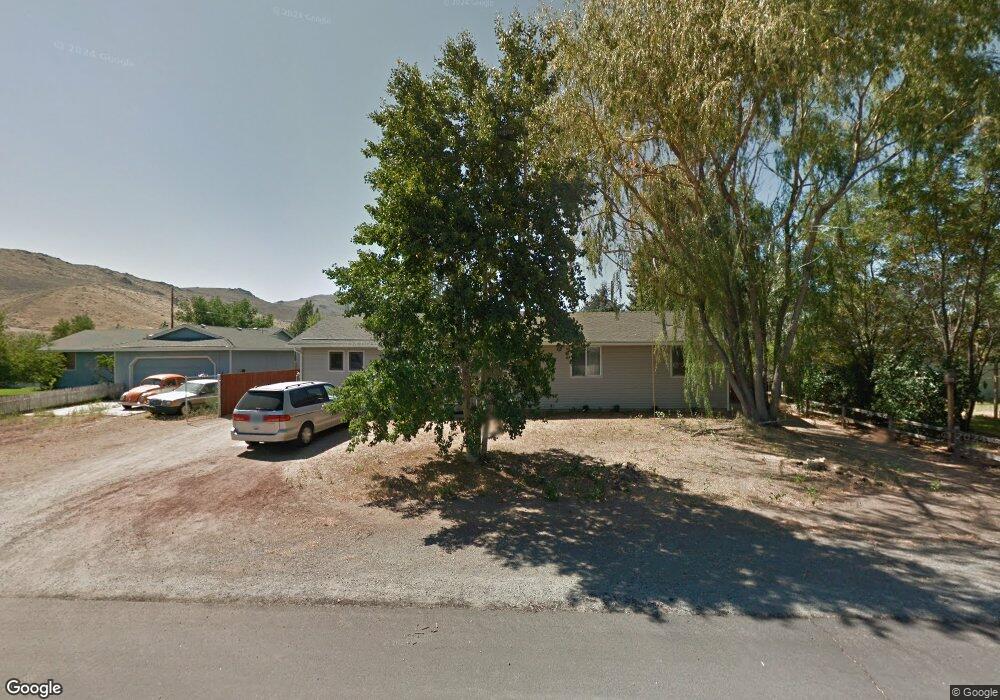
3810 Bittern Ct Reno, NV 89508
Cold Springs NeighborhoodEstimated Value: $390,000 - $397,443
3
Beds
2
Baths
1,408
Sq Ft
$281/Sq Ft
Est. Value
About This Home
This home is located at 3810 Bittern Ct, Reno, NV 89508 and is currently estimated at $395,111, approximately $280 per square foot. 3810 Bittern Ct is a home located in Washoe County with nearby schools including Nancy Gomes Elementary School, Cold Springs Middle School, and North Valleys High School.
Ownership History
Date
Name
Owned For
Owner Type
Purchase Details
Closed on
Nov 19, 2020
Sold by
Donohoe Linda C
Bought by
Donohoe David
Current Estimated Value
Purchase Details
Closed on
Oct 27, 2010
Sold by
Hollibaugh Robert M
Bought by
Donohoe Linda C
Home Financials for this Owner
Home Financials are based on the most recent Mortgage that was taken out on this home.
Original Mortgage
$88,000
Interest Rate
4.33%
Mortgage Type
New Conventional
Purchase Details
Closed on
Dec 6, 2006
Sold by
Hollibaugh Robert M
Bought by
Hollibaugh Robert M and Robert M Hollibaugh Trust
Purchase Details
Closed on
Sep 15, 2005
Sold by
Hollibaugh Robert M and Paulsen Bobbi J
Bought by
Hollibaugh Robert M
Home Financials for this Owner
Home Financials are based on the most recent Mortgage that was taken out on this home.
Original Mortgage
$174,000
Interest Rate
5.76%
Mortgage Type
New Conventional
Purchase Details
Closed on
Mar 23, 2001
Sold by
Corson Brett C and Brasen Corson Karen R
Bought by
Hollibaugh Robert M and Paulsen Bobbi J
Home Financials for this Owner
Home Financials are based on the most recent Mortgage that was taken out on this home.
Original Mortgage
$115,425
Interest Rate
6.98%
Create a Home Valuation Report for This Property
The Home Valuation Report is an in-depth analysis detailing your home's value as well as a comparison with similar homes in the area
Home Values in the Area
Average Home Value in this Area
Purchase History
| Date | Buyer | Sale Price | Title Company |
|---|---|---|---|
| Donohoe David | -- | Donohoe David | |
| Donohoe Linda C | $110,000 | Western Title Company | |
| Hollibaugh Robert M | -- | None Available | |
| Hollibaugh Robert M | -- | First American Title | |
| Hollibaugh Robert M | $121,500 | Stewart Title Northern Nevad |
Source: Public Records
Mortgage History
| Date | Status | Borrower | Loan Amount |
|---|---|---|---|
| Previous Owner | Donohoe Linda C | $88,000 | |
| Previous Owner | Hollibaugh Robert M | $174,000 | |
| Previous Owner | Hollibaugh Robert M | $115,425 |
Source: Public Records
Tax History
| Year | Tax Paid | Tax Assessment Tax Assessment Total Assessment is a certain percentage of the fair market value that is determined by local assessors to be the total taxable value of land and additions on the property. | Land | Improvement |
|---|---|---|---|---|
| 2026 | $1,042 | $72,053 | $30,065 | $41,988 |
| 2025 | $1,351 | $72,529 | $30,065 | $42,464 |
| 2024 | $1,351 | $68,205 | $24,710 | $43,495 |
| 2023 | $1,312 | $69,692 | $28,665 | $41,027 |
| 2022 | $1,274 | $58,975 | $24,885 | $34,090 |
| 2021 | $1,236 | $51,299 | $17,010 | $34,289 |
| 2020 | $1,199 | $51,802 | $16,940 | $34,862 |
| 2019 | $1,164 | $49,452 | $15,435 | $34,017 |
| 2018 | $1,022 | $41,215 | $11,095 | $30,120 |
| 2017 | $992 | $40,354 | $9,660 | $30,694 |
| 2016 | $968 | $40,828 | $9,205 | $31,623 |
| 2015 | $965 | $39,526 | $7,455 | $32,071 |
| 2014 | $937 | $35,026 | $5,495 | $29,531 |
| 2013 | -- | $28,081 | $3,325 | $24,756 |
Source: Public Records
Map
Nearby Homes
- 3825 Dyal Ct
- 17130 E Opal Ct
- 3940 Vireo Ct
- 3440 Canvasback Ln
- 17527 Sunstone Ct
- 17533 Javalina Ct
- 17575 Thrush Ln
- 17862 Bear River Ct
- 5005 Azurite Dr
- 17115 Garnet Dr
- 17839 Empire Ct
- 17685 Mockingbird Ct
- 3855 Sandpiper Dr
- 17755 Fantail Cir
- 17791 Brushland Dr
- 18300 Alderwood Ct
- 17295 Magnetite Dr
- 17320 Magnetite Dr
- 4080 Goldfinch Dr
- 17391 Desert Lake Dr
- 3850 Shearwater Dr
- 3820 Bittern Ct
- 3815 Petrel Ct
- 3825 Petrel Ct
- 3830 Bittern Ct
- 3815 Bittern Ct
- 3905 Shearwater Dr
- 3860 Shearwater Dr
- 3915 Shearwater Dr
- 3840 Bittern Ct Unit 2
- 3825 Bittern Ct
- 3835 Petrel Ct
- 3895 Shearwater Dr
- 3925 Shearwater Dr
- 3835 Bittern Ct
- 3885 Shearwater Dr
- 3935 Shearwater Dr
- 3830 Brant St
- 3840 Petrel Ct
- 3840 Brant St
Your Personal Tour Guide
Ask me questions while you tour the home.