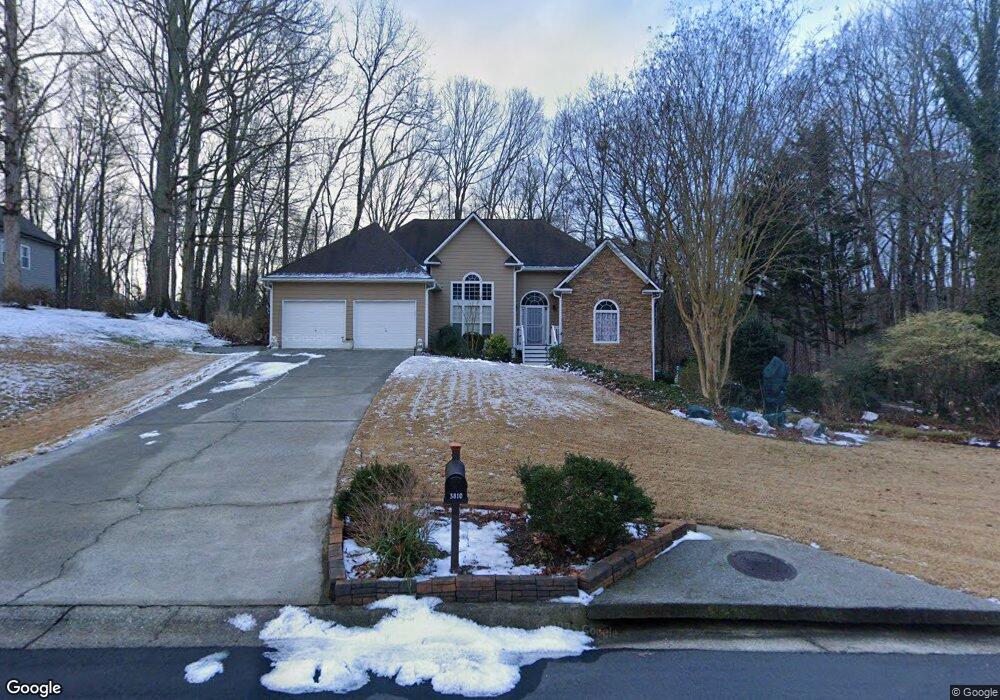
3810 Heartleaf Dr NW Unit 3810 Acworth, GA 30101
Estimated Value: $398,000 - $463,000
3
Beds
2
Baths
2,658
Sq Ft
$163/Sq Ft
Est. Value
About This Home
This home is located at 3810 Heartleaf Dr NW Unit 3810, Acworth, GA 30101 and is currently estimated at $433,704, approximately $163 per square foot. 3810 Heartleaf Dr NW Unit 3810 is a home located in Cobb County with nearby schools including Pickett's Mill Elementary School, Durham Middle School, and Allatoona High School.
Ownership History
Date
Name
Owned For
Owner Type
Purchase Details
Closed on
Mar 1, 2021
Sold by
Fournier Ray L and Fournier Joan Lombardi
Bought by
Vaughan Christopher A and Vaughan Grace R
Current Estimated Value
Home Financials for this Owner
Home Financials are based on the most recent Mortgage that was taken out on this home.
Original Mortgage
$105,000
Outstanding Balance
$93,911
Interest Rate
2.7%
Mortgage Type
New Conventional
Estimated Equity
$339,793
Purchase Details
Closed on
Sep 3, 1999
Sold by
Olde Southern Homes Inc
Bought by
Fournier Ray L and Fournier Joan L
Home Financials for this Owner
Home Financials are based on the most recent Mortgage that was taken out on this home.
Original Mortgage
$136,450
Interest Rate
7.73%
Mortgage Type
New Conventional
Create a Home Valuation Report for This Property
The Home Valuation Report is an in-depth analysis detailing your home's value as well as a comparison with similar homes in the area
Home Values in the Area
Average Home Value in this Area
Purchase History
| Date | Buyer | Sale Price | Title Company |
|---|---|---|---|
| Vaughan Christopher A | $345,000 | None Available | |
| Fournier Ray L | $184,800 | -- |
Source: Public Records
Mortgage History
| Date | Status | Borrower | Loan Amount |
|---|---|---|---|
| Open | Vaughan Christopher A | $105,000 | |
| Previous Owner | Fournier Ray L | $136,450 |
Source: Public Records
Tax History Compared to Growth
Tax History
| Year | Tax Paid | Tax Assessment Tax Assessment Total Assessment is a certain percentage of the fair market value that is determined by local assessors to be the total taxable value of land and additions on the property. | Land | Improvement |
|---|---|---|---|---|
| 2025 | $1,419 | $175,488 | $24,000 | $151,488 |
| 2024 | $1,422 | $175,488 | $24,000 | $151,488 |
| 2023 | $1,216 | $175,488 | $24,000 | $151,488 |
| 2022 | $1,270 | $124,660 | $24,000 | $100,660 |
| 2021 | $875 | $116,108 | $24,000 | $92,108 |
| 2020 | $840 | $104,656 | $24,000 | $80,656 |
| 2019 | $840 | $104,656 | $24,000 | $80,656 |
| 2018 | $799 | $90,808 | $16,000 | $74,808 |
| 2017 | $702 | $90,808 | $16,000 | $74,808 |
| 2016 | $685 | $84,460 | $16,000 | $68,460 |
| 2015 | $623 | $65,716 | $16,000 | $49,716 |
| 2014 | $637 | $65,716 | $0 | $0 |
Source: Public Records
Map
Nearby Homes
- 3917 Dallas Acworth Hwy NW
- 3802 Bayside Passage NW Unit 1
- 3684 Autumn View Dr NW
- 3465 Plantation Ridge NW
- 5851 Bridgemont Place NW
- 4313 Acworth Dallas Rd Lot 2 Dr
- 4077 N Shores Dr NW
- 6206 Cedarcrest Rd NW
- 39 Telfair Ct
- 6205 Arnall Ct NW
- 6214 Treeridge Dr NW
- 64 Telfair Ct
- 71 Vandiver Ct
- 427 Picketts Lake Dr
- 28 Vandiver Ct
- 6191 Talmadge Run NW
- 138 Highcrest Dr
- 1065 Low Water Crossing NW
- 3810 Heartleaf Dr NW
- 3814 Heartleaf Dr NW
- 3806 Heartleaf Dr NW
- 3813 Heartleaf Dr NW
- 3818 Heartleaf Dr NW
- 3805 Heartleaf Dr NW
- 3801 Heartleaf Dr NW
- 3825 Heartleaf Dr NW Unit 2
- 3802 Heartleaf Dr NW Unit 2
- 6156 Autumn View Cove NW Unit 4
- 3822 Heartleaf Dr NW
- 3829 Heartleaf Dr NW
- 6154 Autumn View Cove NW
- 6158 Autumn View Cove NW
- 6152 Autumn View Cove NW
- 3826 Heartleaf Dr NW
- 6160 Autumn View Cove NW
- 6041 Silver Lace Ln NW Unit 1
- 6045 Silver Lace Ln NW
- 6037 Silver Lace Ln NW Unit 1