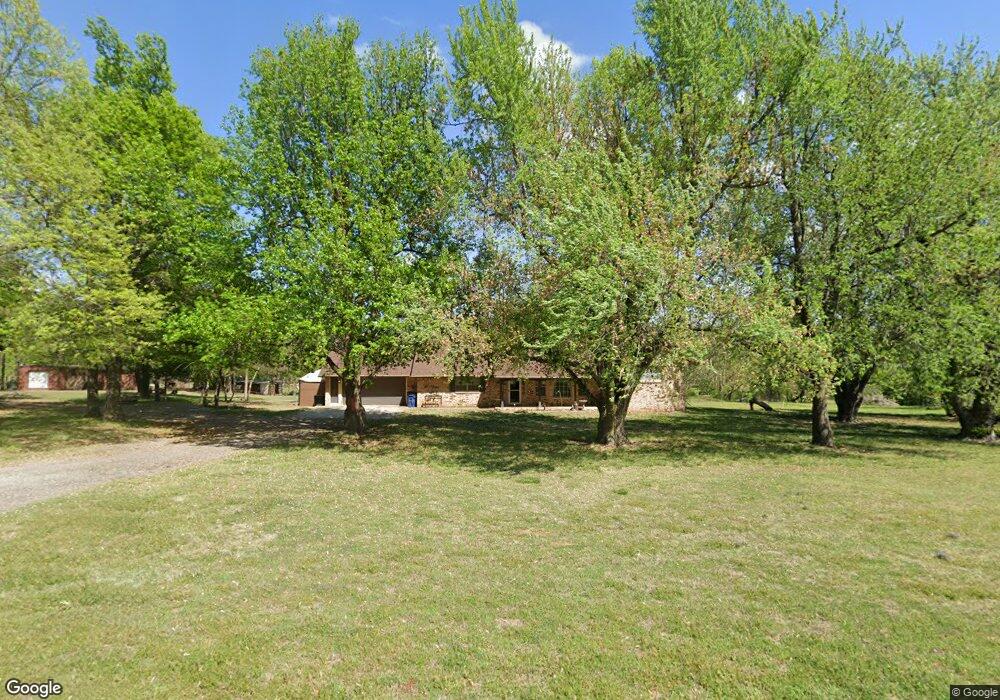
3810 Quail Dr El Reno, OK 73036
Estimated Value: $290,000 - $360,000
3
Beds
3
Baths
2,201
Sq Ft
$149/Sq Ft
Est. Value
About This Home
This home is located at 3810 Quail Dr, El Reno, OK 73036 and is currently estimated at $328,664, approximately $149 per square foot. 3810 Quail Dr is a home located in Canadian County with nearby schools including Darlington Public School.
Ownership History
Date
Name
Owned For
Owner Type
Purchase Details
Closed on
Aug 17, 2015
Sold by
Wilds Chad B and Wilds Megan A
Bought by
Schafer Michael Todd and Schafer Pamela Faith
Current Estimated Value
Home Financials for this Owner
Home Financials are based on the most recent Mortgage that was taken out on this home.
Original Mortgage
$75,000
Outstanding Balance
$29,773
Interest Rate
4.08%
Mortgage Type
New Conventional
Estimated Equity
$298,892
Purchase Details
Closed on
Sep 4, 2009
Sold by
Wilds Lynn D and Wilds Gale
Bought by
Wilds Chad B
Home Financials for this Owner
Home Financials are based on the most recent Mortgage that was taken out on this home.
Original Mortgage
$129,600
Interest Rate
5.26%
Mortgage Type
New Conventional
Purchase Details
Closed on
Feb 15, 2002
Sold by
Wilds Lynn D
Purchase Details
Closed on
Jan 12, 2002
Sold by
Wilds Stephen J
Create a Home Valuation Report for This Property
The Home Valuation Report is an in-depth analysis detailing your home's value as well as a comparison with similar homes in the area
Home Values in the Area
Average Home Value in this Area
Purchase History
| Date | Buyer | Sale Price | Title Company |
|---|---|---|---|
| Schafer Michael Todd | $205,000 | Old Republic Title | |
| Wilds Chad B | $162,000 | Wta | |
| -- | -- | -- | |
| -- | -- | -- |
Source: Public Records
Mortgage History
| Date | Status | Borrower | Loan Amount |
|---|---|---|---|
| Open | Schafer Michael Todd | $75,000 | |
| Previous Owner | Wilds Chad B | $129,600 |
Source: Public Records
Tax History Compared to Growth
Tax History
| Year | Tax Paid | Tax Assessment Tax Assessment Total Assessment is a certain percentage of the fair market value that is determined by local assessors to be the total taxable value of land and additions on the property. | Land | Improvement |
|---|---|---|---|---|
| 2024 | $1,608 | $23,410 | $4,580 | $18,830 |
| 2023 | $1,608 | $22,728 | $4,507 | $18,221 |
| 2022 | $1,561 | $22,067 | $4,425 | $17,642 |
| 2021 | $1,514 | $21,424 | $4,302 | $17,122 |
| 2020 | $1,469 | $20,800 | $4,029 | $16,771 |
| 2019 | $1,424 | $20,194 | $3,764 | $16,430 |
| 2018 | $1,383 | $19,606 | $3,518 | $16,088 |
| 2017 | $1,341 | $19,035 | $3,202 | $15,833 |
| 2016 | $1,302 | $18,481 | $2,700 | $15,781 |
| 2015 | $1,253 | $17,608 | $2,700 | $14,908 |
| 2014 | $1,253 | $17,826 | $2,700 | $15,126 |
Source: Public Records
Map
Nearby Homes
- 8248 Bluestem Trail
- Olympia Plan at Manning Farms
- Trenton Plan at Manning Farms
- Richmond Plan at Manning Farms
- Phoenix Plan at Manning Farms
- Lincoln Plan at Manning Farms
- Hartford Plan at Manning Farms
- Bismarck Plan at Manning Farms
- 8229 Bluestem Trail
- 8218 Bluestem Trail
- 2520 N Manning Rd
- 3531 Manning Farms Blvd
- 8960 N Banner Rd
- 0 Hefner Rd NE
- 0 090149004 Unit 1147019
- 8701 Rebekah Rd
- 11010 N Banner Rd
- 11230 N Banner Rd
- 16751 W Wilshire Blvd
- 0 N Hope Ln Unit 1186936
- 3807 Quail Dr
- 6104 Hummingbird Cir
- 6105 Hummingbird Cir
- 7601 Britton Rd NE
- 3805 Quail Dr
- 3903 Quail Dr
- 3902 Quail Dr
- 8150 Britton Rd NE
- 6103 Hummingbird Cir
- 6100 Hummingbird Cir
- 6104 Mockingbird Ln
- 6104 Mockingbird Ln
- 7401 Britton Rd NE
- 7400 Britton Rd NE
- 4001 Quail Dr
- 6004 Hummingbird Cir
- 6004 Hummingbird Cir
- 6004 Hummingbird Cir
- 6003 Hummingbird Cir
- 4003 Quail Dr