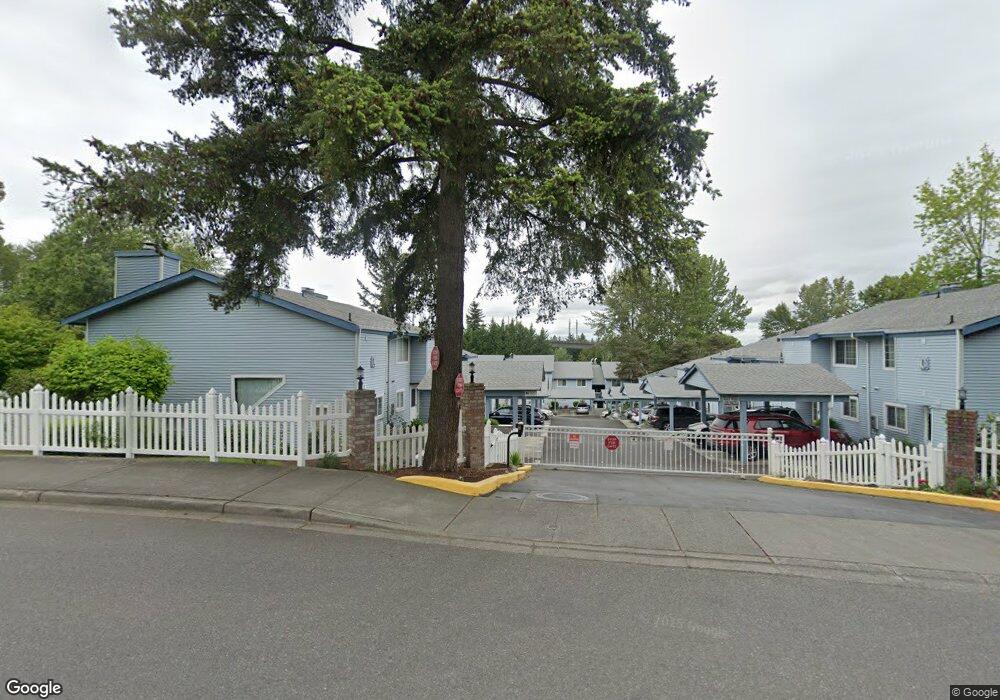
3810 S 158th St Unit B9 Tukwila, WA 98188
McMicken Heights NeighborhoodEstimated Value: $295,000 - $340,000
2
Beds
1
Bath
1,104
Sq Ft
$292/Sq Ft
Est. Value
About This Home
This home is located at 3810 S 158th St Unit B9, Tukwila, WA 98188 and is currently estimated at $321,874, approximately $291 per square foot. 3810 S 158th St Unit B9 is a home located in King County with nearby schools including Tukwila Elementary School, Showalter Middle School, and Foster Senior High School.
Ownership History
Date
Name
Owned For
Owner Type
Purchase Details
Closed on
Jul 25, 2011
Sold by
U S Bank Na
Bought by
Kam Fiora W
Current Estimated Value
Purchase Details
Closed on
May 17, 2010
Sold by
Huddle Frederick H
Bought by
Us Bank Na
Purchase Details
Closed on
Mar 25, 2009
Sold by
Nisco Mark F and Nisco Lu Anne
Bought by
Huddle Frederick H
Home Financials for this Owner
Home Financials are based on the most recent Mortgage that was taken out on this home.
Original Mortgage
$139,000
Interest Rate
5.15%
Purchase Details
Closed on
May 28, 1997
Sold by
Kortum Trudi R
Bought by
Nisco Mark F and Nisco Lu Anne
Home Financials for this Owner
Home Financials are based on the most recent Mortgage that was taken out on this home.
Original Mortgage
$71,250
Interest Rate
8.13%
Purchase Details
Closed on
Jun 5, 1993
Sold by
Boles Nora M
Bought by
Kortum Trudi R
Create a Home Valuation Report for This Property
The Home Valuation Report is an in-depth analysis detailing your home's value as well as a comparison with similar homes in the area
Home Values in the Area
Average Home Value in this Area
Purchase History
| Date | Buyer | Sale Price | Title Company |
|---|---|---|---|
| Kam Fiora W | $89,000 | Ticor | |
| Us Bank Na | $105,756 | None Available | |
| Huddle Frederick H | $139,000 | Stewart Title | |
| Nisco Mark F | $73,500 | -- | |
| Kortum Trudi R | $72,000 | -- |
Source: Public Records
Mortgage History
| Date | Status | Borrower | Loan Amount |
|---|---|---|---|
| Previous Owner | Huddle Frederick H | $139,000 | |
| Previous Owner | Nisco Mark F | $71,250 |
Source: Public Records
Tax History Compared to Growth
Tax History
| Year | Tax Paid | Tax Assessment Tax Assessment Total Assessment is a certain percentage of the fair market value that is determined by local assessors to be the total taxable value of land and additions on the property. | Land | Improvement |
|---|---|---|---|---|
| 2024 | $3,426 | $286,000 | $47,200 | $238,800 |
| 2023 | $2,841 | $279,000 | $46,400 | $232,600 |
| 2022 | $2,834 | $269,000 | $44,600 | $224,400 |
| 2021 | $2,449 | $233,000 | $42,100 | $190,900 |
| 2020 | $2,166 | $203,000 | $41,200 | $161,800 |
| 2018 | $2,204 | $171,000 | $17,100 | $153,900 |
| 2017 | $1,879 | $161,000 | $17,100 | $143,900 |
| 2016 | $1,459 | $141,000 | $17,100 | $123,900 |
| 2015 | $1,378 | $113,000 | $20,600 | $92,400 |
| 2014 | -- | $103,000 | $20,600 | $82,400 |
| 2013 | -- | $72,000 | $20,600 | $51,400 |
Source: Public Records
Map
Nearby Homes
- 4002 S 158th St Unit F
- 15625 42nd Ave S Unit C12
- 15819 42nd Ave S
- 888 S 158th St
- 16035 42nd Ave S
- 3422 S 162nd St
- 4251 S 160th St
- 3228 S 162nd St
- 4624 S 150th St
- 2857 S 152nd St
- 14917 32nd Place S Unit 42
- 4618 S 150th St
- 4913 S 161st St
- 16051 51st Ave S
- 15227 51st Ave S
- 3446 S 146th St
- 14636 46th Ave S
- 14624 46th Ave S
- 2620 S 150th St
- 16442 51st Ave S
- 3810 S 158th St Unit 10B
- 3810 S 158th St Unit A1
- 3810 S 158th St Unit B8
- 3810 S 158th St Unit B10
- 3810 S 158th St Unit C7
- 3810 S 158th St Unit C3
- 3810 S 158th St Unit A6
- 3810 S 158th St Unit B12
- 3810 S 158th St Unit B2
- 3810 S 158th St Unit C1
- 3810 S 158th St Unit A5
- 3810 S 158th St Unit B5
- 3810 S 158th St Unit B11
- 3810 S 158th St Unit C8
- 3810 S 158th St Unit C2
- 3810 S 158th St Unit B7
- 3810 S 158th St Unit C4
- 3810 S 158th St Unit B3
- 3810 S 158th St Unit B4
- 3810 S 158th St Unit B1