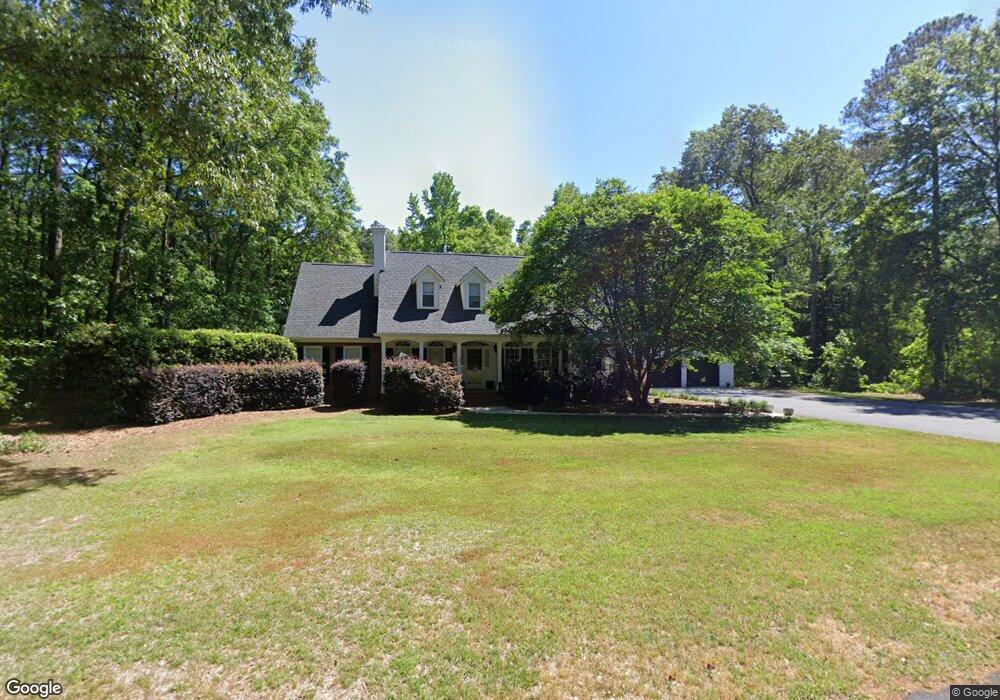
3810 Susan Dr Florence, SC 29501
Estimated Value: $410,173 - $485,000
3
Beds
3
Baths
3,578
Sq Ft
$122/Sq Ft
Est. Value
About This Home
This home is located at 3810 Susan Dr, Florence, SC 29501 and is currently estimated at $437,293, approximately $122 per square foot. 3810 Susan Dr is a home located in Florence County with nearby schools including Lucy T. Davis Elementary School, John W. Moore Middle School, and Henry L. Sneed Middle School.
Ownership History
Date
Name
Owned For
Owner Type
Purchase Details
Closed on
Jun 23, 2020
Sold by
Rowland Kenneth
Bought by
Rowland Kenneth M and Rowland Susan Rebecca
Current Estimated Value
Home Financials for this Owner
Home Financials are based on the most recent Mortgage that was taken out on this home.
Original Mortgage
$207,000
Outstanding Balance
$145,188
Interest Rate
3.1%
Mortgage Type
Future Advance Clause Open End Mortgage
Estimated Equity
$292,105
Purchase Details
Closed on
Aug 17, 2007
Sold by
Bunch Ronald Glenn and Bunch Miriam C
Bought by
Rowland Kenneth
Home Financials for this Owner
Home Financials are based on the most recent Mortgage that was taken out on this home.
Original Mortgage
$254,900
Interest Rate
6.56%
Mortgage Type
Purchase Money Mortgage
Purchase Details
Closed on
Sep 24, 2002
Sold by
Bunch Ronald Glenn
Bought by
Bunch Ronald Glenn and Bunch Miriam C
Create a Home Valuation Report for This Property
The Home Valuation Report is an in-depth analysis detailing your home's value as well as a comparison with similar homes in the area
Home Values in the Area
Average Home Value in this Area
Purchase History
| Date | Buyer | Sale Price | Title Company |
|---|---|---|---|
| Rowland Kenneth M | -- | None Available | |
| Rowland Kenneth | $268,441 | None Available | |
| Bunch Ronald Glenn | -- | -- |
Source: Public Records
Mortgage History
| Date | Status | Borrower | Loan Amount |
|---|---|---|---|
| Open | Rowland Kenneth M | $207,000 | |
| Closed | Rowland Kenneth | $254,900 |
Source: Public Records
Tax History Compared to Growth
Tax History
| Year | Tax Paid | Tax Assessment Tax Assessment Total Assessment is a certain percentage of the fair market value that is determined by local assessors to be the total taxable value of land and additions on the property. | Land | Improvement |
|---|---|---|---|---|
| 2024 | $1,275 | $14,954 | $836 | $14,118 |
| 2023 | $1,111 | $10,617 | $836 | $9,781 |
| 2022 | $1,333 | $10,617 | $836 | $9,781 |
| 2021 | $1,376 | $10,620 | $0 | $0 |
| 2020 | $1,286 | $10,620 | $0 | $0 |
| 2019 | $1,289 | $10,617 | $836 | $9,781 |
| 2018 | $1,170 | $10,620 | $0 | $0 |
| 2017 | $1,105 | $10,620 | $0 | $0 |
| 2016 | $1,024 | $10,620 | $0 | $0 |
| 2015 | $1,012 | $10,620 | $0 | $0 |
| 2014 | $933 | $10,617 | $836 | $9,781 |
Source: Public Records
Map
Nearby Homes
- 3703 State Road S-21-1389
- 708 Muirfield Place
- 3825 Charters Dr
- 345 Magna Carta Rd
- Newlin Plan at Brookshire - Watermill Collection
- Beckman Plan at Brookshire - Watermill Collection
- Lookout Plan at Brookshire - Stonehill Collection
- Idlewood Plan at Brookshire - Stonehill Collection
- Pearce Plan at Brookshire - Watermill Collection
- Woodhaven Plan at Brookshire - Stonehill Collection
- 4286 Monterey Dr
- 4145 Rodanthe Cir
- 4165 Rodanthe Cir
- 4169 Rodanthe Cir
- 4313 Carnoustie Ln
- 608 Stoneybrook Terrace
- 3821 Ashwood Ln
- 711 Harriett Dr
- 731 Coventry Ln
- 724 Caledonia Ct
- 3802 Susan Dr
- 3816 Susan Dr
- 3814 Susan Dr
- 3807 Susan Dr
- 3807 Fletcher St
- 3815 Susan Dr
- 3808 W Dover Dr
- 3820 Susan Dr
- 3819 Susan Dr
- 3818 W Dover Dr
- 3818 W Dover Dr
- 3824 Susan Dr
- 3807 W Dover Dr
- 3811 Fletcher St
- 3823 Susan Dr
- 3813 W Dover Dr
- 212 S Winburn Dr
- 235 S Winburn Dr
- 3806 Fletcher St
- 3819 W Dover Dr