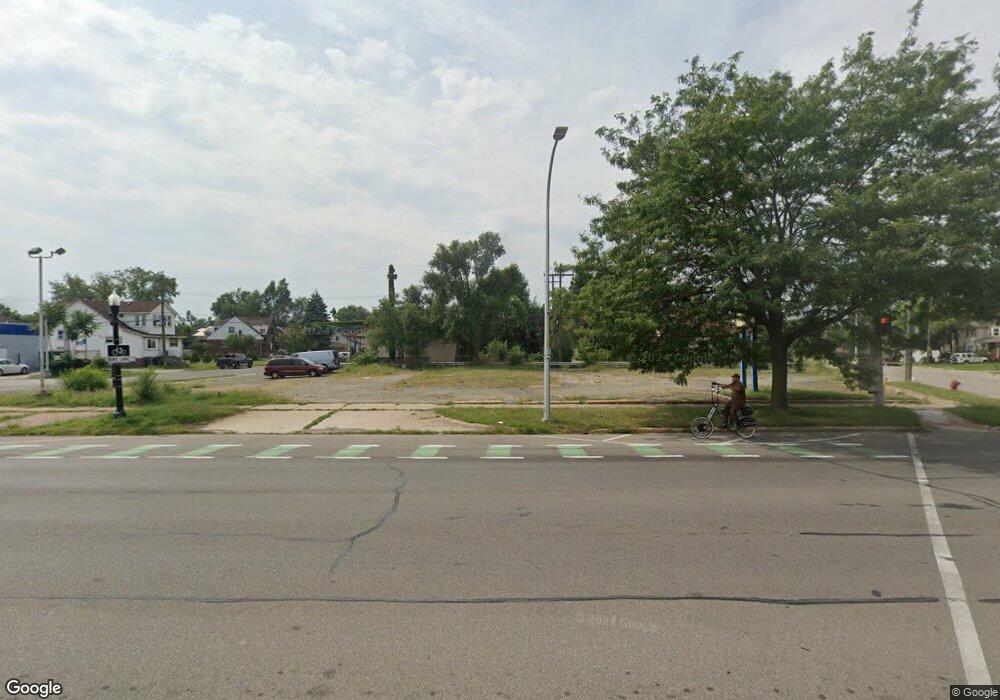
3810 W Jefferson Ave Ecorse, MI 48229
Estimated Value: $118,390
--
Bed
--
Bath
1,800
Sq Ft
$66/Sq Ft
Est. Value
About This Home
This home is located at 3810 W Jefferson Ave, Ecorse, MI 48229 and is currently estimated at $118,390, approximately $65 per square foot. 3810 W Jefferson Ave is a home located in Wayne County with nearby schools including Ralph J. Bunche Elementary, Grandport Academy, and Ecorse High School.
Ownership History
Date
Name
Owned For
Owner Type
Purchase Details
Closed on
Jun 15, 2017
Sold by
3810 W Jefferson Llc
Bought by
Lirato Lisa
Current Estimated Value
Purchase Details
Closed on
Jun 16, 2014
Sold by
Great Lakes Food Llc
Bought by
3810 Jefferson Llc
Purchase Details
Closed on
Jul 6, 2012
Sold by
Great Lakes Food Llc
Bought by
3810 Jefferson Llc
Purchase Details
Closed on
Dec 16, 2009
Sold by
Awad Aref Hamed and Awadh Gawhara
Bought by
Great Lakes Food Llc
Purchase Details
Closed on
Dec 10, 2009
Sold by
Wojtowicz Raymond J
Bought by
Awad Aref Hamed
Purchase Details
Closed on
Mar 5, 2003
Sold by
Rpm Pizza Inc
Bought by
J & H Pizza Inc
Home Financials for this Owner
Home Financials are based on the most recent Mortgage that was taken out on this home.
Original Mortgage
$85,000
Interest Rate
5.71%
Mortgage Type
Commercial
Create a Home Valuation Report for This Property
The Home Valuation Report is an in-depth analysis detailing your home's value as well as a comparison with similar homes in the area
Home Values in the Area
Average Home Value in this Area
Purchase History
| Date | Buyer | Sale Price | Title Company |
|---|---|---|---|
| Lirato Lisa | -- | None Available | |
| 3810 Jefferson Llc | $60,000 | None Available | |
| 3810 Jefferson Llc | -- | Lamont Title Corporation | |
| Great Lakes Food Llc | -- | None Available | |
| Awad Aref Hamed | $28,000 | None Available | |
| J & H Pizza Inc | $70,000 | William T Sheahan Title Co |
Source: Public Records
Mortgage History
| Date | Status | Borrower | Loan Amount |
|---|---|---|---|
| Previous Owner | J & H Pizza Inc | $85,000 |
Source: Public Records
Tax History Compared to Growth
Tax History
| Year | Tax Paid | Tax Assessment Tax Assessment Total Assessment is a certain percentage of the fair market value that is determined by local assessors to be the total taxable value of land and additions on the property. | Land | Improvement |
|---|---|---|---|---|
| 2025 | $1,399 | $26,300 | $0 | $0 |
| 2024 | $1,399 | $23,700 | $0 | $0 |
| 2023 | $1,332 | $23,900 | $0 | $0 |
| 2022 | $3,770 | $34,800 | $0 | $0 |
| 2021 | $3,834 | $29,400 | $0 | $0 |
| 2019 | $4,555 | $35,000 | $0 | $0 |
| 2018 | $2,148 | $34,100 | $0 | $0 |
| 2017 | $3,794 | $33,900 | $0 | $0 |
| 2016 | $3,748 | $28,600 | $0 | $0 |
| 2015 | $2,936 | $29,800 | $0 | $0 |
| 2013 | $3,430 | $54,900 | $0 | $0 |
| 2012 | $1,966 | $34,200 | $23,700 | $10,500 |
Source: Public Records
Map
Nearby Homes
- 19 Bell St
- 33 Bell St
- 37 Ruth St
- 50 E Rockwood St
- 54 Elton St
- 47 W Rockwood St
- 47 E Rockwood St
- 10 E Auburn Ave
- 71 E Glenwood St
- 40 W Rockwood St
- 36 W Charlotte St
- 70 E Rockwood St
- 20 W Auburn St
- 25 W Charlotte St
- 53 W Charlotte St
- 19 Orchard St
- 27 Orchard St
- 49 Orchard St
- 43 W Alexis St
- 37 Le Blanc St