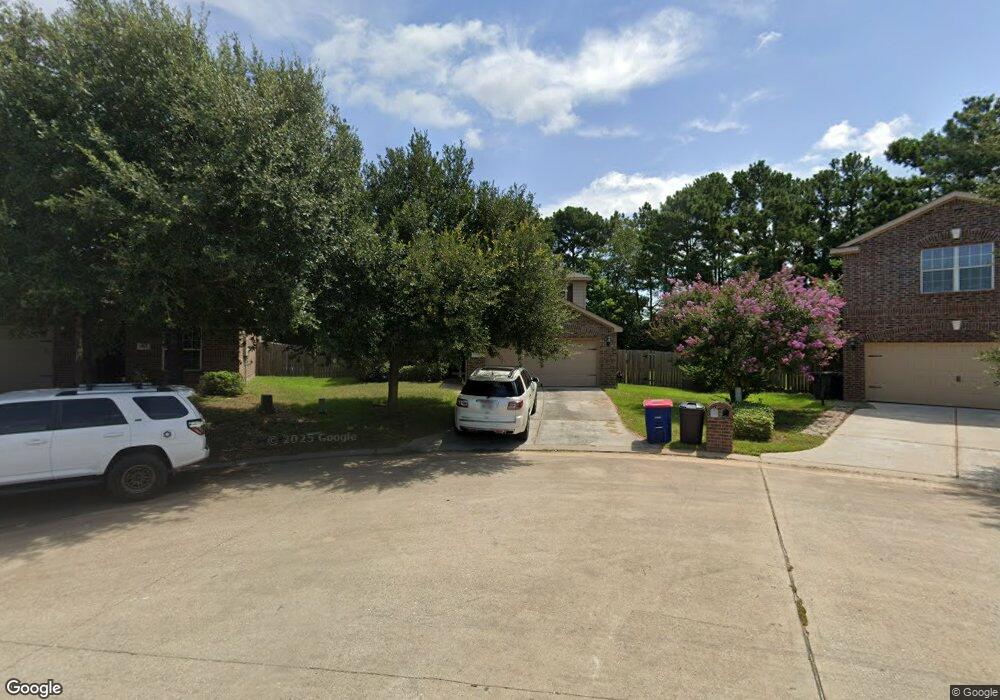
38102 N Sweetwater Cir Magnolia, TX 77355
Estimated Value: $288,056 - $443,000
--
Bed
1
Bath
2,154
Sq Ft
$154/Sq Ft
Est. Value
About This Home
This home is located at 38102 N Sweetwater Cir, Magnolia, TX 77355 and is currently estimated at $332,514, approximately $154 per square foot. 38102 N Sweetwater Cir is a home with nearby schools including Magnolia Elementary School, Magnolia Sixth Grade Campus, and Magnolia Junior High School.
Ownership History
Date
Name
Owned For
Owner Type
Purchase Details
Closed on
Sep 3, 2014
Sold by
Redd Wesley Eugene
Bought by
Abernathy Redd Wesley Eugene and Abernathy Bonilla Sandra
Current Estimated Value
Purchase Details
Closed on
Feb 19, 2014
Sold by
Lgi Homes Lakes Of Magnolia Llc
Bought by
Redd Wesley Eugene
Home Financials for this Owner
Home Financials are based on the most recent Mortgage that was taken out on this home.
Original Mortgage
$182,737
Outstanding Balance
$139,202
Interest Rate
4.55%
Mortgage Type
VA
Estimated Equity
$193,312
Purchase Details
Closed on
Jul 12, 2013
Sold by
Dci Of Magnolia Inc
Bought by
Redd Wesley E and Bonilla Sandra A
Purchase Details
Closed on
May 13, 2011
Sold by
Lajolla Land Company
Bought by
Redd Wesley E and Bonilla Sandra A
Create a Home Valuation Report for This Property
The Home Valuation Report is an in-depth analysis detailing your home's value as well as a comparison with similar homes in the area
Home Values in the Area
Average Home Value in this Area
Purchase History
| Date | Buyer | Sale Price | Title Company |
|---|---|---|---|
| Abernathy Redd Wesley Eugene | -- | None Available | |
| Redd Wesley Eugene | -- | Texas American Title Company | |
| Redd Wesley E | -- | -- | |
| Redd Wesley E | -- | -- |
Source: Public Records
Mortgage History
| Date | Status | Borrower | Loan Amount |
|---|---|---|---|
| Open | Redd Wesley Eugene | $182,737 |
Source: Public Records
Tax History Compared to Growth
Tax History
| Year | Tax Paid | Tax Assessment Tax Assessment Total Assessment is a certain percentage of the fair market value that is determined by local assessors to be the total taxable value of land and additions on the property. | Land | Improvement |
|---|---|---|---|---|
| 2025 | $1,031 | $323,961 | $50,078 | $273,883 |
| 2024 | $988 | $295,460 | -- | -- |
| 2023 | $988 | $268,600 | $50,080 | $268,210 |
| 2022 | $4,309 | $244,180 | $50,080 | $228,310 |
| 2021 | $4,126 | $221,980 | $50,080 | $171,900 |
| 2020 | $4,219 | $208,500 | $50,080 | $158,420 |
| 2019 | $4,046 | $200,900 | $50,080 | $158,140 |
| 2018 | $2,871 | $182,640 | $24,500 | $158,140 |
| 2017 | $3,941 | $185,860 | $24,500 | $161,360 |
| 2016 | $3,823 | $180,290 | $24,500 | $155,790 |
| 2015 | $939 | $164,990 | $24,500 | $140,490 |
| 2014 | $939 | $66,330 | $24,500 | $41,830 |
Source: Public Records
Map
Nearby Homes
- 31011 E Lost Creek Blvd
- 31015 E Lost Creek Blvd
- 38214 E Sulphur Creek Dr
- 30607 N Sulphur Creek Dr
- 30515 Red Bluff Cir
- 30731 N Cripple Creek Dr
- 28812 Village Bend
- 30814 N Cripple Creek Dr
- 30714 Meadow Wood Lot 64 Dr
- TBD N Cripple Creek Dr
- 28822 Village Bend
- 18735 Creek Falls Ln
- 37402 Robin George Trail
- 37121 Fm 1774
- 38910 Fm 1774 Rd
- 100 Sterling River Ln
- 135 Sterling River Ln
- 29122 Champions Dr
- 29232 Sky Forest
- 28713 Wood Song Trail
- 38106 N Sweetwater Cir
- 38114 N Sweetwater Cir
- 30915 Sweetwater Cir
- 30910 Sweetwater Cir
- 38118 N Sweetwater Cir
- 30911 Sweetwater Cir
- 30906 Sweetwater Cir
- 31006 E Lost Creek Blvd
- 38122 N Sweetwater Cir
- 30907 Sweetwater Cir
- 30914 E Lost Creek Blvd
- 31010 E Lost Creek Blvd
- 30902 Sweetwater Cir
- 31014 E Lost Creek Blvd
- 30910 E Lost Creek Blvd
- 30903 Sweetwater Cir
- 30923 E E Lost Creek Blv
- 30906 E Lost Creek Blvd
- 31018 E Lost Creek Blvd
- 31022 E Lost Creek Blvd