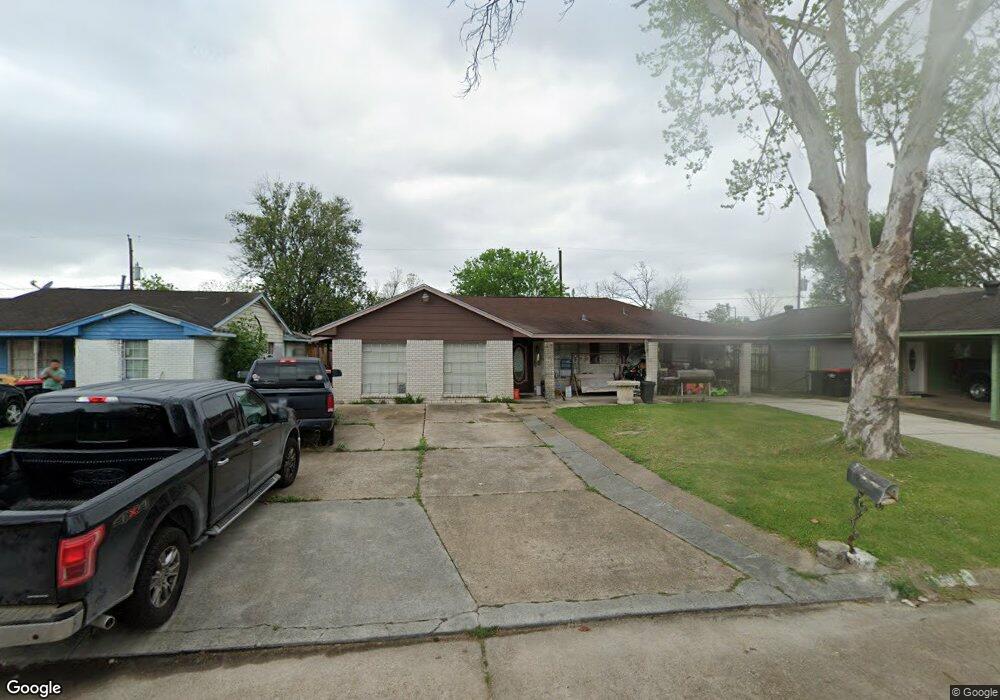
3811 Cherry Meadow Dr Houston, TX 77039
East Aldine NeighborhoodEstimated Value: $204,000 - $259,000
4
Beds
3
Baths
2,214
Sq Ft
$103/Sq Ft
Est. Value
About This Home
This home is located at 3811 Cherry Meadow Dr, Houston, TX 77039 and is currently estimated at $227,749, approximately $102 per square foot. 3811 Cherry Meadow Dr is a home located in Harris County with nearby schools including Vardeman EC/PK/K, Stephens Elementary School, and Macarthur Ninth Grade School.
Ownership History
Date
Name
Owned For
Owner Type
Purchase Details
Closed on
Aug 9, 2024
Sold by
Guajardo Anthony and Mata Maria Esther
Bought by
H & E Guajardo Llc
Current Estimated Value
Purchase Details
Closed on
Apr 18, 2024
Sold by
Guajardo Hugo Humberto and Guajardo William
Bought by
Guajardo Anthony and Mata Maria Esther
Home Financials for this Owner
Home Financials are based on the most recent Mortgage that was taken out on this home.
Original Mortgage
$153,000
Interest Rate
6.89%
Mortgage Type
New Conventional
Purchase Details
Closed on
Jun 10, 1999
Sold by
Hilal Danny
Bought by
Guajardo Hugo and Guajardo Maria N
Home Financials for this Owner
Home Financials are based on the most recent Mortgage that was taken out on this home.
Original Mortgage
$40,000
Interest Rate
7.11%
Mortgage Type
Credit Line Revolving
Purchase Details
Closed on
Feb 10, 1994
Sold by
Tamayo Rosie
Bought by
Hilal Danny
Create a Home Valuation Report for This Property
The Home Valuation Report is an in-depth analysis detailing your home's value as well as a comparison with similar homes in the area
Home Values in the Area
Average Home Value in this Area
Purchase History
| Date | Buyer | Sale Price | Title Company |
|---|---|---|---|
| H & E Guajardo Llc | -- | None Listed On Document | |
| Guajardo Anthony | -- | None Listed On Document | |
| Guajardo Hugo Humberto | -- | None Listed On Document | |
| Guajardo Hugo | -- | Allecon Title | |
| Hilal Danny | -- | -- |
Source: Public Records
Mortgage History
| Date | Status | Borrower | Loan Amount |
|---|---|---|---|
| Previous Owner | Guajardo Hugo Humberto | $153,000 | |
| Previous Owner | Guajardo Hugo | $40,000 |
Source: Public Records
Tax History Compared to Growth
Tax History
| Year | Tax Paid | Tax Assessment Tax Assessment Total Assessment is a certain percentage of the fair market value that is determined by local assessors to be the total taxable value of land and additions on the property. | Land | Improvement |
|---|---|---|---|---|
| 2025 | $7,360 | $287,247 | $33,990 | $253,257 |
| 2024 | $7,360 | $277,979 | $33,990 | $243,989 |
| 2023 | $7,360 | $262,664 | $33,990 | $228,674 |
| 2022 | $4,072 | $235,304 | $24,278 | $211,026 |
| 2021 | $3,898 | $209,681 | $24,278 | $185,403 |
| 2020 | $3,820 | $198,774 | $24,278 | $174,496 |
| 2019 | $3,589 | $179,325 | $14,567 | $164,758 |
| 2018 | $3,201 | $98,000 | $14,567 | $83,433 |
| 2017 | $3,105 | $98,000 | $14,567 | $83,433 |
| 2016 | $2,823 | $98,000 | $14,567 | $83,433 |
| 2015 | $1,311 | $97,344 | $14,567 | $82,777 |
| 2014 | $1,311 | $74,000 | $14,567 | $59,433 |
Source: Public Records
Map
Nearby Homes
- 11769 Gloger St
- 11937 Connor St
- 4002 Charriton Dr
- 3503 Debeney Dr
- 4522 Collins Rd
- 3111 Hartwick Rd
- 4422 Sandydale Ln
- 2723 Castledale Dr
- 9213 Washington St
- 4007 Wedgewood St
- 12123 Steeple Ln
- 4803 Bethany Ln
- 3214 Brea Crest St
- 2915 Brea Crest St
- 4801 Marquita Ln
- 2410 Mierianne St
- 4415 Mooney Rd
- 11781 Eastex Fwy
- 11716 Innsbury Dr
- 3418 Hopper Rd
- 3807 Cherry Meadow Dr
- 3815 Cherry Meadow Dr
- 3810 Pine Meadow Ln
- 3814 Pine Meadow Ln
- 3803 Cherry Meadow Dr
- 3903 Cherry Meadow Dr
- 3806 Pine Meadow Ln
- 3902 Pine Meadow Ln
- 3810 Cherry Meadow Dr
- 3814 Cherry Meadow Dr
- 3802 Pine Meadow Ln
- 3806 Cherry Meadow Dr
- 3719 Cherry Meadow Dr
- 3907 Cherry Meadow Dr
- 3902 Cherry Meadow Dr
- 3906 Pine Meadow Ln
- 3802 Cherry Meadow Dr
- 3714 Pine Meadow Ln
- 3715 Cherry Meadow Dr
- 3911 Cherry Meadow Dr