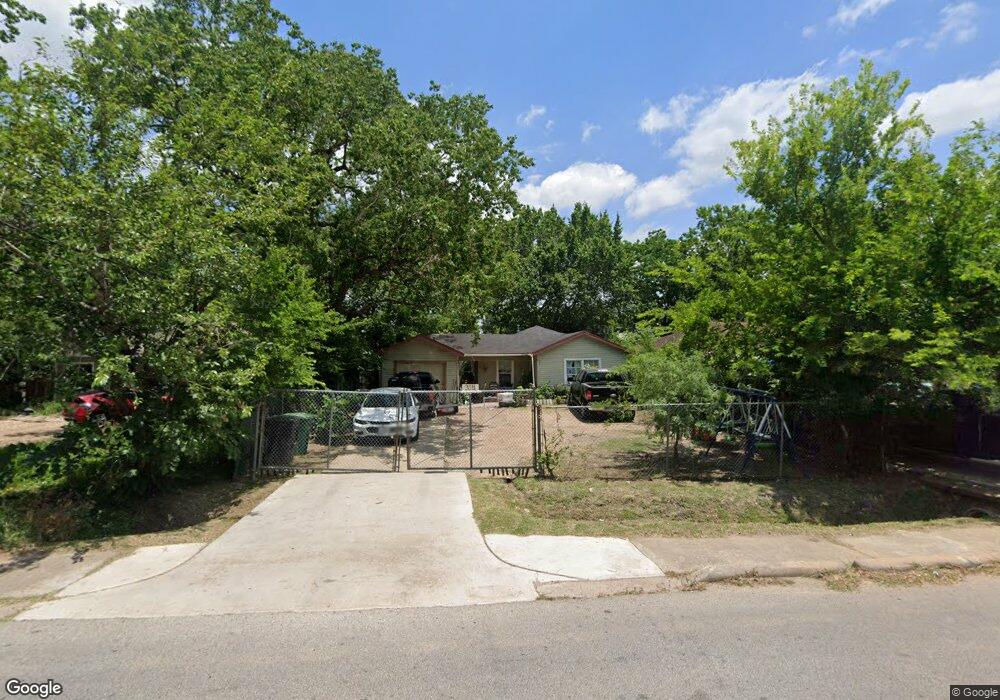
3811 Corder St Houston, TX 77021
OST-South Union NeighborhoodEstimated Value: $130,856 - $175,000
2
Beds
1
Bath
903
Sq Ft
$174/Sq Ft
Est. Value
About This Home
This home is located at 3811 Corder St, Houston, TX 77021 and is currently estimated at $156,964, approximately $173 per square foot. 3811 Corder St is a home located in Harris County with nearby schools including Whidby Elementary School, Cullen Middle School, and Yates High School.
Ownership History
Date
Name
Owned For
Owner Type
Purchase Details
Closed on
Nov 13, 2002
Sold by
Khera Tirath S
Bought by
Delgado Juan J
Current Estimated Value
Home Financials for this Owner
Home Financials are based on the most recent Mortgage that was taken out on this home.
Original Mortgage
$59,500
Outstanding Balance
$24,885
Interest Rate
6%
Mortgage Type
Purchase Money Mortgage
Estimated Equity
$132,079
Purchase Details
Closed on
Dec 27, 2001
Sold by
Norwest Bank Minnesota Na
Bought by
Khera Tirath S
Purchase Details
Closed on
Jul 3, 2001
Sold by
Bankers Trust Company Of California Na
Bought by
Norwest Bank Minnesota Na and Saco I Inc 1999-3
Purchase Details
Closed on
Oct 31, 1996
Sold by
Sunnyside Up Inc
Bought by
Benton Cindy
Home Financials for this Owner
Home Financials are based on the most recent Mortgage that was taken out on this home.
Original Mortgage
$30,400
Interest Rate
8.15%
Mortgage Type
Seller Take Back
Create a Home Valuation Report for This Property
The Home Valuation Report is an in-depth analysis detailing your home's value as well as a comparison with similar homes in the area
Home Values in the Area
Average Home Value in this Area
Purchase History
| Date | Buyer | Sale Price | Title Company |
|---|---|---|---|
| Delgado Juan J | -- | American Title Co | |
| Khera Tirath S | -- | First American Title | |
| Norwest Bank Minnesota Na | -- | -- | |
| Saco I Inc Series 1999-3 | $22,500 | -- | |
| Benton Cindy | -- | Chicago Title |
Source: Public Records
Mortgage History
| Date | Status | Borrower | Loan Amount |
|---|---|---|---|
| Open | Delgado Juan J | $59,500 | |
| Previous Owner | Benton Cindy | $30,400 | |
| Closed | Benton Cindy | $3,062 |
Source: Public Records
Tax History Compared to Growth
Tax History
| Year | Tax Paid | Tax Assessment Tax Assessment Total Assessment is a certain percentage of the fair market value that is determined by local assessors to be the total taxable value of land and additions on the property. | Land | Improvement |
|---|---|---|---|---|
| 2025 | $899 | $132,830 | $112,344 | $20,486 |
| 2024 | $899 | $128,106 | $102,982 | $25,124 |
| 2023 | $899 | $128,233 | $98,301 | $29,932 |
| 2022 | $1,665 | $120,908 | $84,258 | $36,650 |
| 2021 | $1,602 | $84,579 | $51,491 | $33,088 |
| 2020 | $1,513 | $68,012 | $31,597 | $36,415 |
| 2019 | $1,438 | $56,813 | $24,575 | $32,238 |
| 2018 | $774 | $52,861 | $21,065 | $31,796 |
| 2017 | $1,256 | $52,861 | $21,065 | $31,796 |
| 2016 | $1,142 | $45,156 | $14,063 | $31,093 |
| 2015 | $753 | $45,156 | $14,063 | $31,093 |
| 2014 | $753 | $45,156 | $14,063 | $31,093 |
Source: Public Records
Map
Nearby Homes
- 3824 Amos St
- 3617 Dreyfus St
- 3827 Amos St
- 7209 La Salette St
- 3734 Corder St
- 3810 Lehall St
- 3830 Mount Pleasant St
- 3804 Mount Pleasant St Unit 9
- 3730 Lehall St
- 3722 Nathaniel Brown St
- 3706 Nathaniel Brown St
- 3814 Seabrook St
- 3624 Corder St
- 3848 Seabrook St
- 3634 Dreyfus St
- 3811 Noah St
- 3839 Noah St Unit A/B
- 3638 Nathaniel Brown St
- 3655 Seabrook St
- 3733 Noah St
- 3815 Corder St
- 3807 Corder St
- 3810 Dreyfus St
- 3814 Dreyfus St
- 3806 Dreyfus St
- 3803 Corder St
- 3819 Corder St
- 3818 Dreyfus St
- 3802 Dreyfus St
- 3823 Corder St
- 3822 Dreyfus St
- 3747 Corder St
- 3827 Corder St
- 3746 Dreyfus St
- 3826 Dreyfus St
- 3811 Dreyfus St
- 3815 Dreyfus St
- 3807 Dreyfus St
- 3743 Corder St
- 3819 Dreyfus St