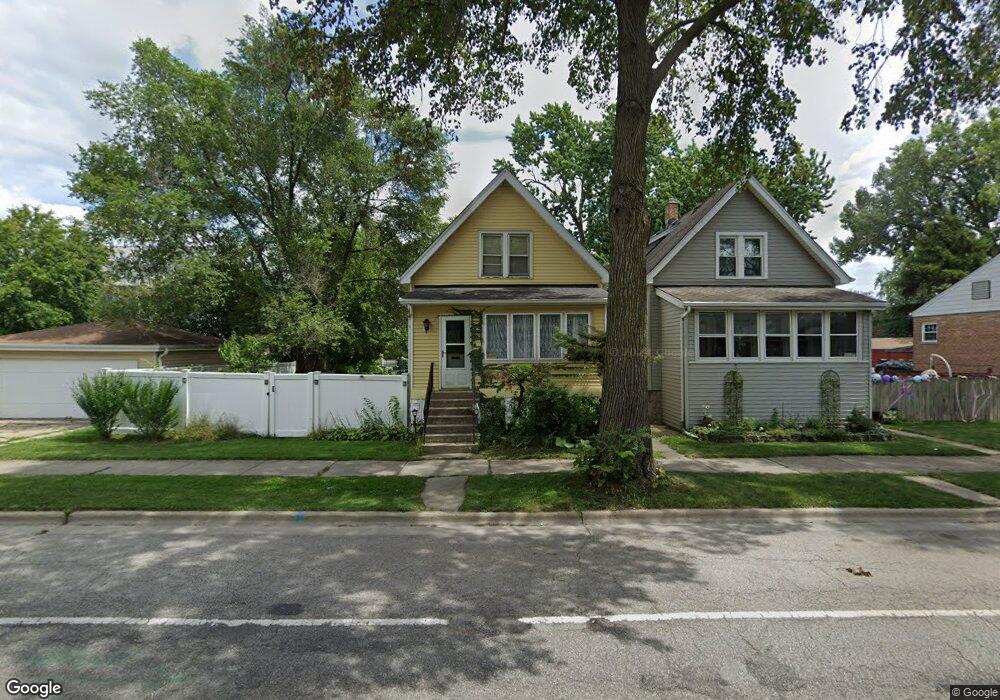
3811 Maple Ave Brookfield, IL 60513
Estimated Value: $328,978 - $375,000
3
Beds
2
Baths
1,001
Sq Ft
$355/Sq Ft
Est. Value
About This Home
This home is located at 3811 Maple Ave, Brookfield, IL 60513 and is currently estimated at $354,995, approximately $354 per square foot. 3811 Maple Ave is a home located in Cook County with nearby schools including S. E. Gross Middle School, Brook Park Elementary School, and Riverside Brookfield High School.
Ownership History
Date
Name
Owned For
Owner Type
Purchase Details
Closed on
Aug 30, 2024
Sold by
Crawley Linda G
Bought by
Cerino Paige A
Current Estimated Value
Home Financials for this Owner
Home Financials are based on the most recent Mortgage that was taken out on this home.
Original Mortgage
$192,000
Outstanding Balance
$190,098
Interest Rate
7.13%
Mortgage Type
New Conventional
Estimated Equity
$164,897
Purchase Details
Closed on
Jul 9, 2008
Sold by
Crawley Mark J and Crawley Linda G
Bought by
Crawley Mark J and Crawley Linda G
Home Financials for this Owner
Home Financials are based on the most recent Mortgage that was taken out on this home.
Original Mortgage
$231,420
Interest Rate
6.15%
Mortgage Type
New Conventional
Purchase Details
Closed on
Aug 12, 2002
Sold by
Pryde Geraldine and Banas Geraldine
Bought by
Crawley Mark J and Michalovic Linda G
Home Financials for this Owner
Home Financials are based on the most recent Mortgage that was taken out on this home.
Original Mortgage
$167,350
Interest Rate
6.56%
Mortgage Type
FHA
Create a Home Valuation Report for This Property
The Home Valuation Report is an in-depth analysis detailing your home's value as well as a comparison with similar homes in the area
Home Values in the Area
Average Home Value in this Area
Purchase History
| Date | Buyer | Sale Price | Title Company |
|---|---|---|---|
| Cerino Paige A | $240,000 | None Listed On Document | |
| Crawley Mark J | -- | Citywide Title Corporation | |
| Crawley Mark J | $170,000 | Multiple |
Source: Public Records
Mortgage History
| Date | Status | Borrower | Loan Amount |
|---|---|---|---|
| Open | Cerino Paige A | $192,000 | |
| Previous Owner | Crawley Mark J | $231,420 | |
| Previous Owner | Crawley Mark J | $167,350 |
Source: Public Records
Tax History Compared to Growth
Tax History
| Year | Tax Paid | Tax Assessment Tax Assessment Total Assessment is a certain percentage of the fair market value that is determined by local assessors to be the total taxable value of land and additions on the property. | Land | Improvement |
|---|---|---|---|---|
| 2024 | $7,028 | $23,000 | $2,344 | $20,656 |
| 2023 | $7,016 | $23,000 | $2,344 | $20,656 |
| 2022 | $7,016 | $20,259 | $2,031 | $18,228 |
| 2021 | $6,843 | $20,259 | $2,031 | $18,228 |
| 2020 | $6,756 | $20,259 | $2,031 | $18,228 |
| 2019 | $6,426 | $19,724 | $1,796 | $17,928 |
| 2018 | $6,168 | $19,724 | $1,796 | $17,928 |
| 2017 | $5,707 | $19,724 | $1,796 | $17,928 |
| 2016 | $4,938 | $15,764 | $1,640 | $14,124 |
| 2015 | $5,797 | $18,826 | $1,640 | $17,186 |
| 2014 | $5,732 | $18,826 | $1,640 | $17,186 |
| 2013 | $5,208 | $18,441 | $1,640 | $16,801 |
Source: Public Records
Map
Nearby Homes
- 3931 Maple Ave
- 3923 Madison Ave
- 9003 Burlington Ave
- 3617 Park Ave
- 3621 Madison Ave
- 3800 Harrison Ave
- 3713 Grand Blvd Unit 10
- 8911 Burlington Ave
- 4144 Elm Ave
- 4125 Deyo Ave
- 4154 Elm Ave
- 4009 Forest Ave
- 3831 Grove Ave Unit 1S
- 3913 Grove Ave
- 4118 Prairie Ave
- 4210 Maple Ave
- 3417 Oak Ave
- 326 Kemman Ave
- 4113 Eberly Ave
- 3336 Grand Blvd