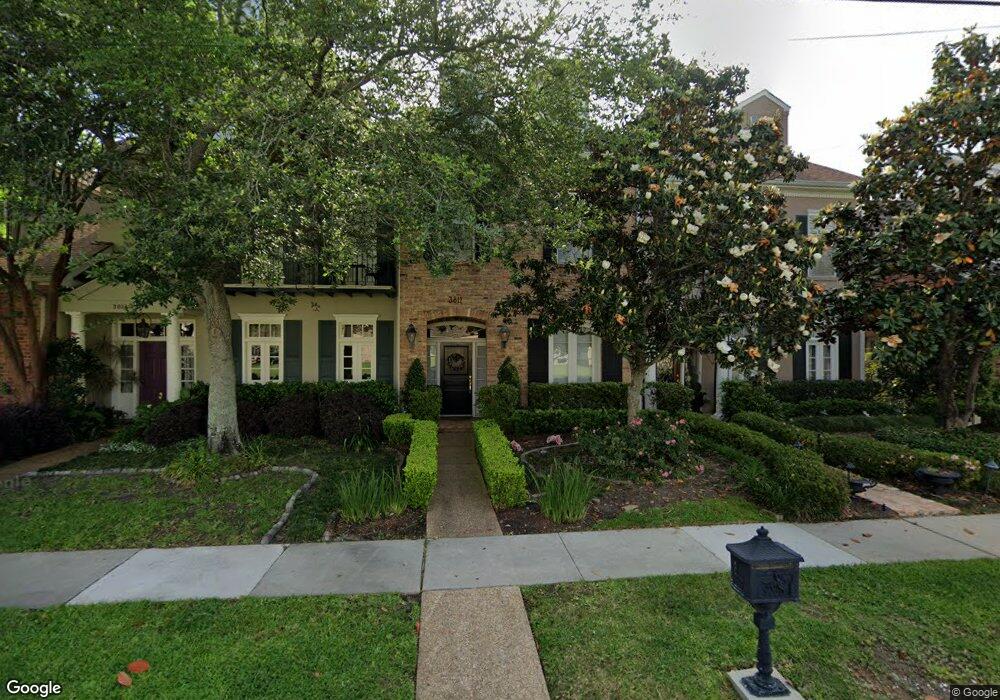
3811 N Hullen St Unit C Metairie, LA 70002
Metairie Lakefront NeighborhoodEstimated Value: $563,340 - $581,000
2
Beds
3
Baths
2,800
Sq Ft
$205/Sq Ft
Est. Value
About This Home
This home is located at 3811 N Hullen St Unit C, Metairie, LA 70002 and is currently estimated at $573,585, approximately $204 per square foot. 3811 N Hullen St Unit C is a home located in Jefferson Parish with nearby schools including Harold Keller Elementary School, Metairie Academy For Advanced Studies, and J.D. Meisler Middle School.
Ownership History
Date
Name
Owned For
Owner Type
Purchase Details
Closed on
Jun 18, 2024
Sold by
Gensler Lawrence
Bought by
Provenzano Mia and Provenzano Carrie
Current Estimated Value
Home Financials for this Owner
Home Financials are based on the most recent Mortgage that was taken out on this home.
Original Mortgage
$438,400
Outstanding Balance
$433,016
Interest Rate
7.22%
Mortgage Type
New Conventional
Estimated Equity
$140,569
Purchase Details
Closed on
Mar 19, 2020
Sold by
Calogero Thomas More
Bought by
Gensler Lawrence L
Purchase Details
Closed on
Dec 5, 2005
Sold by
Asaro Robert J
Bought by
Calogero Thomas M
Home Financials for this Owner
Home Financials are based on the most recent Mortgage that was taken out on this home.
Original Mortgage
$355,000
Interest Rate
6.12%
Create a Home Valuation Report for This Property
The Home Valuation Report is an in-depth analysis detailing your home's value as well as a comparison with similar homes in the area
Home Values in the Area
Average Home Value in this Area
Purchase History
| Date | Buyer | Sale Price | Title Company |
|---|---|---|---|
| Provenzano Mia | $548,000 | Oak Title | |
| Gensler Lawrence L | $497,000 | None Available | |
| Calogero Thomas M | $430,000 | -- |
Source: Public Records
Mortgage History
| Date | Status | Borrower | Loan Amount |
|---|---|---|---|
| Open | Provenzano Mia | $438,400 | |
| Previous Owner | Calogero Thomas M | $355,000 |
Source: Public Records
Tax History Compared to Growth
Tax History
| Year | Tax Paid | Tax Assessment Tax Assessment Total Assessment is a certain percentage of the fair market value that is determined by local assessors to be the total taxable value of land and additions on the property. | Land | Improvement |
|---|---|---|---|---|
| 2024 | $1,755 | $42,680 | $3,320 | $39,360 |
| 2023 | $5,615 | $42,680 | $2,660 | $40,020 |
| 2022 | $5,468 | $42,680 | $2,660 | $40,020 |
| 2021 | $5,079 | $42,680 | $2,660 | $40,020 |
| 2020 | $5,042 | $42,680 | $2,660 | $40,020 |
| 2019 | $5,183 | $42,680 | $2,660 | $40,020 |
| 2018 | $3,989 | $42,680 | $2,660 | $40,020 |
| 2017 | $4,840 | $42,680 | $2,660 | $40,020 |
| 2016 | $4,746 | $42,680 | $2,660 | $40,020 |
| 2015 | $3,818 | $41,440 | $2,130 | $39,310 |
| 2014 | $3,818 | $41,440 | $2,130 | $39,310 |
Source: Public Records
Map
Nearby Homes
- 3717 N Hullen St
- 3813 N Arnoult Rd
- 3704 Severn Ave
- 3637 N Hullen St
- 3400 W Esplanade Ave N Unit D
- 3479 W Esplanade Ave N
- 3832 Edenborn Ave
- 3701 Ridgelake Dr
- 3928 Edenborn Ave
- 3005 7th St Unit C
- 3628 Tolmas Dr
- 4804 Chateau Dr
- 3901 N Labarre Rd
- 3805 N Labarre Rd
- 3705 Rue Emilion
- 3536 N Labarre Rd
- 4323 Division St Unit 101-A
- 4218 Hessmer Ave Unit 301
- 3532 Clifford Dr
- 3424 Tolmas Dr
- 3811 N Hullen St
- 3809 N Hullen St
- 3809 N Hullen St Unit C
- 3813 N Hullen St
- 3813 N Hullen St Unit E
- 3807 N Hullen St
- 3815 N Hullen St
- 3805 N Hullen St
- 3805 N Hullen St Unit B
- 3803 N Hullen St Unit C
- 3803 N Hullen St
- 3801 N Hullen St
- 3801 N Hullen St Unit E
- 3741 N Hullen St
- 3817 N Hullen St
- 3816 N Hullen St
- 3737 N Hullen St
- 3737 N Hullen St Unit C
- 3821 N Hullen St
- 3408 6th St