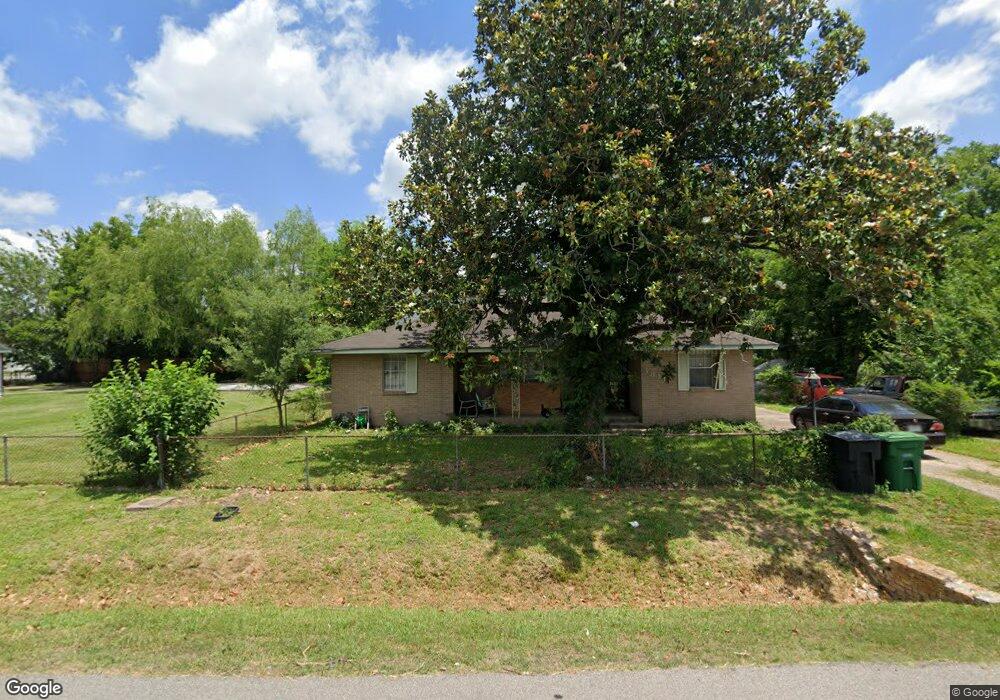
3811 Seabrook St Houston, TX 77021
OST-South Union NeighborhoodEstimated Value: $261,000 - $433,000
4
Beds
3
Baths
2,958
Sq Ft
$113/Sq Ft
Est. Value
About This Home
This home is located at 3811 Seabrook St, Houston, TX 77021 and is currently estimated at $335,157, approximately $113 per square foot. 3811 Seabrook St is a home located in Harris County with nearby schools including Whidby Elementary School, Cullen Middle School, and Yates High School.
Ownership History
Date
Name
Owned For
Owner Type
Purchase Details
Closed on
Apr 15, 2017
Sold by
Conway Sheila and Conway James
Bought by
Conway Sheila and Conway James
Current Estimated Value
Purchase Details
Closed on
Jan 11, 2017
Sold by
Baugh Rayland Lee
Bought by
Conway Sheila and Conway James
Purchase Details
Closed on
Aug 7, 2003
Sold by
Stewart Shellie B
Bought by
Baugh Carolyn Ann
Create a Home Valuation Report for This Property
The Home Valuation Report is an in-depth analysis detailing your home's value as well as a comparison with similar homes in the area
Home Values in the Area
Average Home Value in this Area
Purchase History
| Date | Buyer | Sale Price | Title Company |
|---|---|---|---|
| Conway Sheila | -- | None Available | |
| Conway Sheila | -- | None Available | |
| Baugh Carolyn Ann | -- | -- |
Source: Public Records
Tax History Compared to Growth
Tax History
| Year | Tax Paid | Tax Assessment Tax Assessment Total Assessment is a certain percentage of the fair market value that is determined by local assessors to be the total taxable value of land and additions on the property. | Land | Improvement |
|---|---|---|---|---|
| 2025 | $4,955 | $214,996 | $153,120 | $61,876 |
| 2024 | $4,955 | $236,823 | $140,360 | $96,463 |
| 2023 | $5,089 | $252,577 | $133,980 | $118,597 |
| 2022 | $4,422 | $200,832 | $114,840 | $85,992 |
| 2021 | $3,930 | $168,636 | $70,180 | $98,456 |
| 2020 | $3,790 | $156,505 | $43,065 | $113,440 |
| 2019 | $3,383 | $133,689 | $33,495 | $100,194 |
| 2018 | $3,211 | $127,521 | $28,710 | $98,811 |
| 2017 | $3,224 | $127,521 | $28,710 | $98,811 |
| 2016 | $2,435 | $96,300 | $19,140 | $77,160 |
| 2015 | $2,476 | $96,300 | $19,140 | $77,160 |
| 2014 | $2,476 | $96,300 | $19,140 | $77,160 |
Source: Public Records
Map
Nearby Homes
- 3804 Mount Pleasant St Unit 9
- 3814 Seabrook St
- 3811 Noah St
- 3733 Noah St
- 7209 La Salette St
- 3830 Mount Pleasant St
- 3704 Seabrook St
- 3655 Seabrook St
- 3652 Seabrook St Unit A and B
- 3722 Nathaniel Brown St
- 3706 Nathaniel Brown St
- 3734 Corder St
- 3848 Seabrook St
- 3534 Mainer St
- 3540 Mainer St
- 3839 Noah St Unit A/B
- 3710 Noah St
- 3835 Mainer St
- 3837 Mainer St
- 3638 Nathaniel Brown St
- 3801 Seabrook St
- 3808 Mount Pleasant St
- 3810 Mount Pleasant St Unit 1-14
- 3810 Mount Pleasant St
- 3814 Mount Pleasant St
- 3810 Seabrook St
- 3806 Seabrook St
- 3820 Mount Pleasant St
- 3802 Seabrook St
- 3822 Mount Pleasant St
- 3818 Seabrook St
- 3741 Seabrook St
- 3825 Seabrook St
- 3800 Mt Pleasant St
- 3800 Mount Pleasant St
- 3733 & 3741 Seabrook St
- 3826 Mount Pleasant St
- 3813 Mount Pleasant St
- 3823 Mount Pleasant St
- 3815 Mount Pleasant St