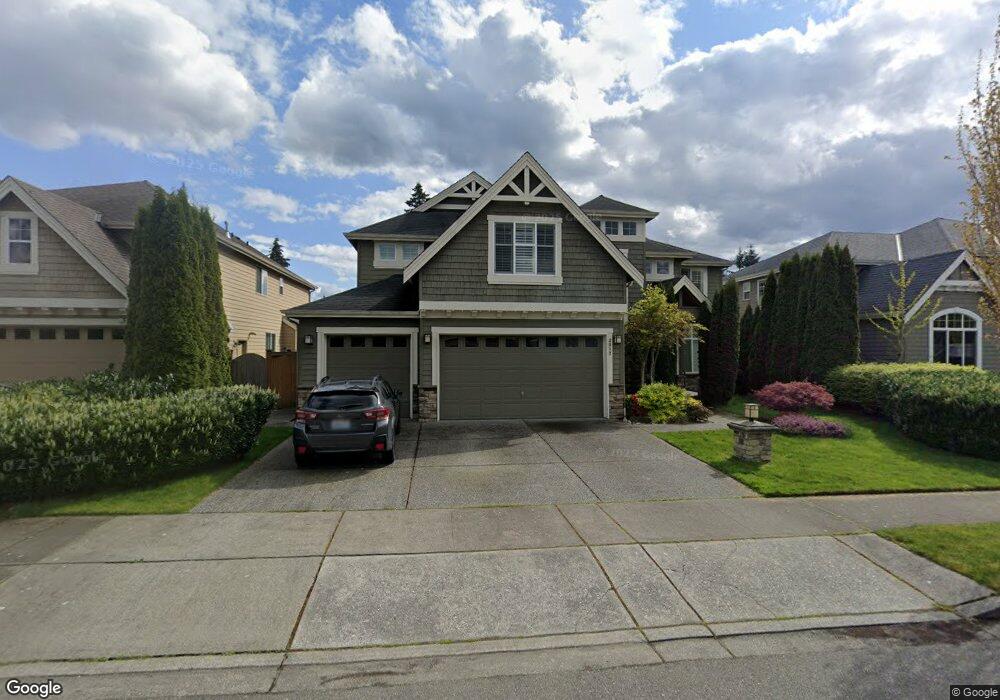
3812 209th St SE Bothell, WA 98021
Canyon Creek NeighborhoodEstimated Value: $1,623,000 - $1,805,022
4
Beds
4
Baths
3,664
Sq Ft
$468/Sq Ft
Est. Value
About This Home
This home is located at 3812 209th St SE, Bothell, WA 98021 and is currently estimated at $1,715,506, approximately $468 per square foot. 3812 209th St SE is a home located in Snohomish County with nearby schools including Canyon Creek Elementary School, Skyview Middle School, and North Creek High School.
Ownership History
Date
Name
Owned For
Owner Type
Purchase Details
Closed on
Dec 26, 2024
Sold by
Vora Mina T and Vora Sanjiv P
Bought by
Vora Family Revocable Trust and Vora
Current Estimated Value
Purchase Details
Closed on
Aug 13, 2012
Sold by
Vora Sanjip P and Vora Mina T
Bought by
Vora Mina T and Vora Sanjiv P
Purchase Details
Closed on
Apr 6, 2012
Sold by
Vora Mina T and Vora Sanjiv P
Bought by
Vora Sanjiv P and Vora Mina T
Purchase Details
Closed on
Oct 24, 2011
Sold by
Critchlow Homes Inc
Bought by
Vora Mina T and Vora Sanjiv P
Home Financials for this Owner
Home Financials are based on the most recent Mortgage that was taken out on this home.
Original Mortgage
$433,600
Interest Rate
4.02%
Mortgage Type
New Conventional
Create a Home Valuation Report for This Property
The Home Valuation Report is an in-depth analysis detailing your home's value as well as a comparison with similar homes in the area
Home Values in the Area
Average Home Value in this Area
Purchase History
| Date | Buyer | Sale Price | Title Company |
|---|---|---|---|
| Vora Family Revocable Trust | $313 | None Listed On Document | |
| Vora Mina T | -- | None Available | |
| Vora Sanjiv P | -- | None Available | |
| Vora Mina T | $542,280 | Chicago Title Company |
Source: Public Records
Mortgage History
| Date | Status | Borrower | Loan Amount |
|---|---|---|---|
| Previous Owner | Vora Mina T | $433,600 |
Source: Public Records
Tax History
| Year | Tax Paid | Tax Assessment Tax Assessment Total Assessment is a certain percentage of the fair market value that is determined by local assessors to be the total taxable value of land and additions on the property. | Land | Improvement |
|---|---|---|---|---|
| 2025 | $13,019 | $1,745,900 | $735,000 | $1,010,900 |
| 2024 | $13,019 | $1,460,800 | $643,000 | $817,800 |
| 2023 | $13,014 | $1,627,600 | $745,000 | $882,600 |
| 2022 | $12,154 | $1,209,200 | $460,000 | $749,200 |
| 2020 | $10,886 | $1,021,800 | $420,000 | $601,800 |
| 2019 | $9,124 | $984,600 | $420,000 | $564,600 |
| 2018 | $8,696 | $768,500 | $290,000 | $478,500 |
| 2017 | $7,949 | $715,700 | $235,000 | $480,700 |
| 2016 | $7,685 | $675,500 | $215,000 | $460,500 |
Source: Public Records
Map
Nearby Homes
- 3323 207th Place SE
- 3928 214th Place SE Unit B
- 4001 215th St SE Unit A
- 3618 202nd St SE
- 20500 32nd Dr SE
- 3422 201st Place SE
- 20911 30th Dr SE
- 4026 215th Place SE
- 20501 31st Dr SE
- 21417 43rd Dr SE Unit 19
- 3912 199th Place SE
- 21705 38th Dr SE
- 3924 190th Place SE
- 3908 199th SE
- 20327 45th Dr SE
- 3916 199th Place SE
- 4010 199th Place SE
- 4014 199th Place SE
- 19923 40th Dr SE
- 4013 199th Place SE
- 3818 209th St SE
- 3806 209th St SE
- 3824 209th St SE
- 3828 209th St SE
- 3815 209th St SE
- 3807 209th St SE
- 3823 209th St SE
- 3814 209th Place SE
- 3808 209th St SE
- 3808 209th Place SE
- 3729 209th St SE
- 3820 209th Place SE
- 20912 39th Ave SE
- 3729 209th Place SE
- 3732 209th Place SE
- 3826 209th Place SE
- 3721 209th St SE
- 3728 209th Place SE
- 206121 37th Ave SE
- 20810 39th Ave SE
Your Personal Tour Guide
Ask me questions while you tour the home.