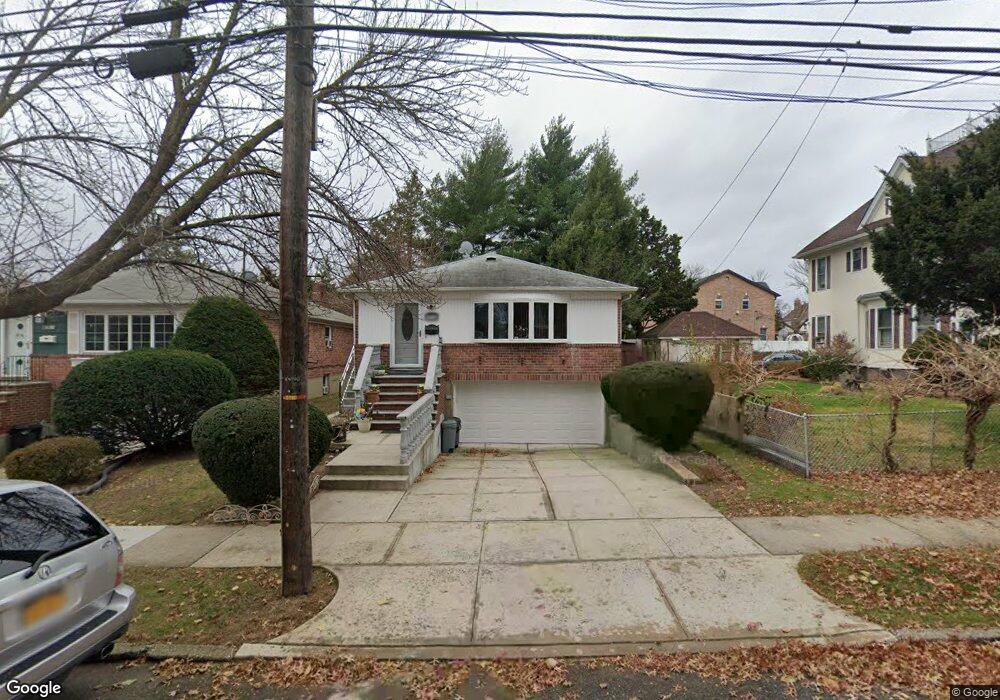
3812 211th St Bayside, NY 11361
Bayside NeighborhoodEstimated Value: $1,148,000 - $1,180,186
Studio
--
Bath
1,560
Sq Ft
$746/Sq Ft
Est. Value
About This Home
This home is located at 3812 211th St, Bayside, NY 11361 and is currently estimated at $1,163,047, approximately $745 per square foot. 3812 211th St is a home located in Queens County with nearby schools including P.S. 159 Queens, M.S. 158 - Marie Curie, and Bayside High School.
Ownership History
Date
Name
Owned For
Owner Type
Purchase Details
Closed on
May 20, 2025
Sold by
Benjamin Chan As Trustee and Qiao Ling Xu Irrevocable Trust
Bought by
Xu Long
Current Estimated Value
Home Financials for this Owner
Home Financials are based on the most recent Mortgage that was taken out on this home.
Original Mortgage
$438,000
Outstanding Balance
$435,741
Interest Rate
6.83%
Mortgage Type
Purchase Money Mortgage
Estimated Equity
$727,306
Purchase Details
Closed on
Apr 19, 2023
Sold by
Wing Leung Tong Revocable Trust Dated Ma and Wing Leung Tong As Trustee
Bought by
Benjamin Chan As Trustee and Qiao Ling Xu Irrevocable Trust Dated 06/
Purchase Details
Closed on
May 26, 2022
Sold by
Leung Tong Wing
Bought by
Wing Leung Tong Revocable Trust and Wing Leung Tong As Trustee
Purchase Details
Closed on
Nov 16, 2020
Sold by
Tong Siu Ling
Bought by
Tong Raymond and Tong Simon
Purchase Details
Closed on
Jan 10, 1992
Sold by
Vingiello Joseph A
Bought by
Tong Siu Ling and Tong Wing Leung
Create a Home Valuation Report for This Property
The Home Valuation Report is an in-depth analysis detailing your home's value as well as a comparison with similar homes in the area
Home Values in the Area
Average Home Value in this Area
Purchase History
| Date | Buyer | Sale Price | Title Company |
|---|---|---|---|
| Xu Long | $1,128,000 | -- | |
| Xu Long | $1,128,000 | -- | |
| Benjamin Chan As Trustee | $1,100,000 | -- | |
| Benjamin Chan As Trustee | $1,100,000 | -- | |
| Benjamin Chan As Trustee | $1,100,000 | -- | |
| Wing Leung Tong Revocable Trust | -- | -- | |
| Wing Leung Tong Revocable Trust | -- | -- | |
| Wing Leung Tong Revocable Trust | -- | -- | |
| Tong Raymond | -- | -- | |
| Tong Raymond | -- | -- | |
| Tong Siu Ling | -- | -- | |
| Tong Siu Ling | -- | -- |
Source: Public Records
Mortgage History
| Date | Status | Borrower | Loan Amount |
|---|---|---|---|
| Open | Xu Long | $438,000 | |
| Closed | Xu Long | $438,000 |
Source: Public Records
Tax History
| Year | Tax Paid | Tax Assessment Tax Assessment Total Assessment is a certain percentage of the fair market value that is determined by local assessors to be the total taxable value of land and additions on the property. | Land | Improvement |
|---|---|---|---|---|
| 2025 | $9,996 | $52,752 | $10,493 | $42,259 |
| 2024 | $9,996 | $49,766 | $10,225 | $39,541 |
| 2023 | $9,715 | $48,371 | $8,990 | $39,381 |
| 2022 | $9,783 | $58,620 | $13,080 | $45,540 |
| 2021 | $9,806 | $62,340 | $13,080 | $49,260 |
| 2020 | $9,009 | $61,080 | $13,080 | $48,000 |
| 2019 | $8,383 | $62,400 | $13,080 | $49,320 |
| 2018 | $7,919 | $40,309 | $7,668 | $32,641 |
| 2017 | $7,883 | $40,143 | $9,410 | $30,733 |
| 2016 | $7,453 | $40,143 | $9,410 | $30,733 |
| 2015 | $4,348 | $36,633 | $10,213 | $26,420 |
| 2014 | $4,348 | $34,560 | $10,654 | $23,906 |
Source: Public Records
Map
Nearby Homes
- 38-24 213th St
- 36-30 213th St Unit 1A
- 39-26 213th St
- 210-50 41st Ave Unit 1c
- 209-10 41st Ave Unit 2E
- 209-10 41st Ave Unit 3R
- 207-15 39th Ave
- 33-17 208th St
- 210-15 23 Unit 2F
- 47-22 215 Place Unit 2C
- 213-02 42nd Ave Unit 2A
- 214-35 39th Ave
- 214-31 39th Ave
- 211-22 34th Rd
- 42-23 212th St Unit 3-C
- 38-22 Clearview Expy
- 34-30 Corporal Kennedy St
- 38-40 215th St
- 214-39 39th Ave
- 207-04 42nd Ave
Your Personal Tour Guide
Ask me questions while you tour the home.