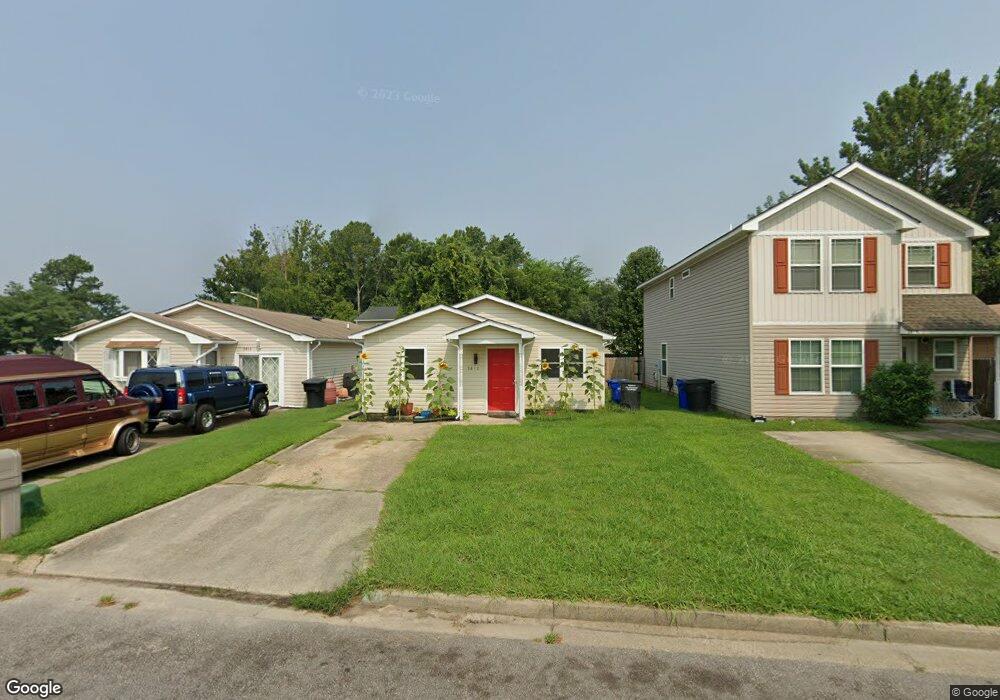
3812 Peach Orchard Cir Portsmouth, VA 23703
Churchland NeighborhoodEstimated Value: $206,000 - $214,000
3
Beds
1
Bath
1,082
Sq Ft
$195/Sq Ft
Est. Value
About This Home
This home is located at 3812 Peach Orchard Cir, Portsmouth, VA 23703 and is currently estimated at $210,680, approximately $194 per square foot. 3812 Peach Orchard Cir is a home located in Portsmouth City with nearby schools including Churchland Primary/Intermediate School, Churchland Middle School, and Churchland High School.
Ownership History
Date
Name
Owned For
Owner Type
Purchase Details
Closed on
Apr 13, 2023
Sold by
House Buyers Of America Inc
Bought by
Rey-Harrigan Whitney
Current Estimated Value
Home Financials for this Owner
Home Financials are based on the most recent Mortgage that was taken out on this home.
Original Mortgage
$199,192
Outstanding Balance
$193,584
Interest Rate
6.73%
Mortgage Type
VA
Estimated Equity
$17,096
Purchase Details
Closed on
Feb 17, 2023
Sold by
Sexton Charles W and Sexton Pamela C
Bought by
House Buyers Of America Inc
Home Financials for this Owner
Home Financials are based on the most recent Mortgage that was taken out on this home.
Original Mortgage
$199,192
Outstanding Balance
$193,584
Interest Rate
6.73%
Mortgage Type
VA
Estimated Equity
$17,096
Create a Home Valuation Report for This Property
The Home Valuation Report is an in-depth analysis detailing your home's value as well as a comparison with similar homes in the area
Home Values in the Area
Average Home Value in this Area
Purchase History
| Date | Buyer | Sale Price | Title Company |
|---|---|---|---|
| Rey-Harrigan Whitney | $195,000 | Priority Title | |
| House Buyers Of America Inc | $115,000 | -- |
Source: Public Records
Mortgage History
| Date | Status | Borrower | Loan Amount |
|---|---|---|---|
| Open | Rey-Harrigan Whitney | $199,192 | |
| Previous Owner | House Buyers Of America Inc | $131,250 |
Source: Public Records
Tax History Compared to Growth
Tax History
| Year | Tax Paid | Tax Assessment Tax Assessment Total Assessment is a certain percentage of the fair market value that is determined by local assessors to be the total taxable value of land and additions on the property. | Land | Improvement |
|---|---|---|---|---|
| 2025 | $2,339 | $179,640 | $52,390 | $127,250 |
| 2024 | $2,339 | $176,220 | $52,390 | $123,830 |
| 2023 | $1,781 | $142,490 | $44,530 | $97,960 |
| 2022 | $1,665 | $128,110 | $35,630 | $92,480 |
| 2021 | $1,507 | $115,900 | $29,690 | $86,210 |
| 2020 | $1,437 | $110,560 | $28,270 | $82,290 |
| 2019 | $1,386 | $106,640 | $28,270 | $78,370 |
| 2018 | $1,346 | $103,510 | $28,270 | $75,240 |
| 2017 | $1,325 | $101,940 | $28,270 | $73,670 |
| 2016 | $1,305 | $100,370 | $28,270 | $72,100 |
| 2015 | $1,284 | $98,800 | $28,270 | $70,530 |
| 2014 | $1,255 | $98,800 | $28,270 | $70,530 |
Source: Public Records
Map
Nearby Homes
- 3877 Peachtree Ln W
- 3818 Peach Orchard Cir
- 3913 Stateflower Ct
- 3817 Harvest Ct
- 3866 Augustine Cir
- 3860 Sugar Creek Cir
- 3791 Towne Point Rd
- 3660B Towne Point Rd Unit A
- 17 Shoal Ct
- 3715 Magnolia Dr
- 3705 Bamboo Rd
- 4071 Long Point Blvd
- 4100 Mayfair Way
- 8 Compass Ct
- 6446 Olde Bullocks Cir
- 6417 Pelican Crescent N
- 3433 Willow Breeze Dr
- 3836 Old Farm Rd
- 5807 Dunkin St
- 3616 Bowden St
- 3814 Peach Orchard Cir
- 3810 Peach Orchard Cir
- 3816 Peach Orchard Cir
- 3873 Peachtree Ln W
- 3869 Peachtree Ln W
- 3875 Peachtree Ln W
- 3820 Peach Orchard Cir
- 3813 Peach Orchard Cir
- 3815 Peach Orchard Cir
- 3879 Peachtree Ln W
- 3817 Peach Orchard Cir
- 3803 Peach Orchard Cir
- 3811 Peach Orchard Cir
- 3819 Peach Orchard Cir
- 3809 Peach Orchard Cir
- 3805 Peach Orchard Cir
- 3822 Peach Orchard Cir
- 3807 Peach Orchard Cir
- 3821 Peach Orchard Cir
- 3881 Peachtree Ln W