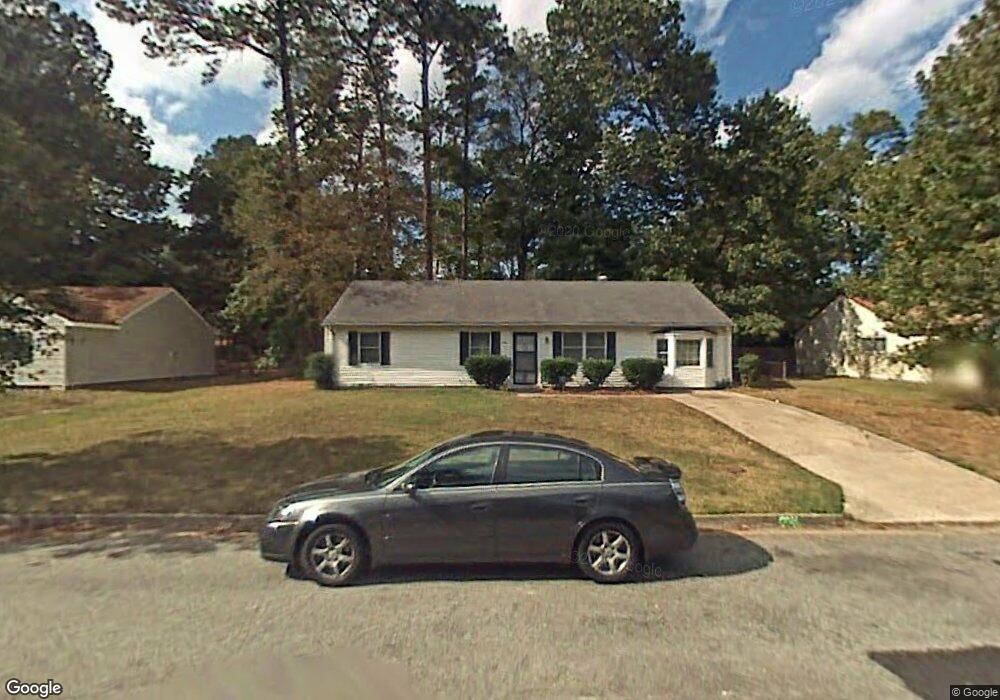
3812 Red Barn Rd Portsmouth, VA 23703
Churchland NeighborhoodEstimated Value: $282,033 - $299,000
4
Beds
2
Baths
1,400
Sq Ft
$207/Sq Ft
Est. Value
About This Home
This home is located at 3812 Red Barn Rd, Portsmouth, VA 23703 and is currently estimated at $290,258, approximately $207 per square foot. 3812 Red Barn Rd is a home located in Portsmouth City with nearby schools including Churchland Primary/Intermediate School, Churchland Middle School, and Churchland High School.
Ownership History
Date
Name
Owned For
Owner Type
Purchase Details
Closed on
Oct 24, 2019
Sold by
Crowell Christopher
Bought by
Vanderpool Grant Richard
Current Estimated Value
Home Financials for this Owner
Home Financials are based on the most recent Mortgage that was taken out on this home.
Original Mortgage
$191,105
Outstanding Balance
$167,759
Interest Rate
3.6%
Estimated Equity
$122,499
Purchase Details
Closed on
Feb 22, 2013
Sold by
Sutryk Frank
Bought by
Crowell Christopher
Home Financials for this Owner
Home Financials are based on the most recent Mortgage that was taken out on this home.
Original Mortgage
$143,000
Interest Rate
3.44%
Mortgage Type
VA
Purchase Details
Closed on
Aug 15, 2012
Sold by
Profl Foreclosure Corp Of Va and King Shawm M
Bought by
Sutryk Frank
Home Financials for this Owner
Home Financials are based on the most recent Mortgage that was taken out on this home.
Original Mortgage
$95,235
Interest Rate
3.62%
Mortgage Type
Construction
Purchase Details
Closed on
Jun 11, 1999
Sold by
Hawkins William E
Bought by
King Shawn M
Home Financials for this Owner
Home Financials are based on the most recent Mortgage that was taken out on this home.
Original Mortgage
$77,503
Interest Rate
6.9%
Create a Home Valuation Report for This Property
The Home Valuation Report is an in-depth analysis detailing your home's value as well as a comparison with similar homes in the area
Home Values in the Area
Average Home Value in this Area
Purchase History
| Date | Buyer | Sale Price | Title Company |
|---|---|---|---|
| Vanderpool Grant Richard | $185,000 | True North Title | |
| Crowell Christopher | $143,000 | -- | |
| Sutryk Frank | $74,542 | -- | |
| King Shawn M | $78,000 | -- |
Source: Public Records
Mortgage History
| Date | Status | Borrower | Loan Amount |
|---|---|---|---|
| Open | Vanderpool Grant Richard | $191,105 | |
| Previous Owner | Crowell Christopher | $143,000 | |
| Previous Owner | Sutryk Frank | $95,235 | |
| Previous Owner | King Shawn M | $77,503 |
Source: Public Records
Tax History Compared to Growth
Tax History
| Year | Tax Paid | Tax Assessment Tax Assessment Total Assessment is a certain percentage of the fair market value that is determined by local assessors to be the total taxable value of land and additions on the property. | Land | Improvement |
|---|---|---|---|---|
| 2025 | $3,146 | $242,940 | $86,400 | $156,540 |
| 2024 | $3,146 | $241,880 | $86,400 | $155,480 |
| 2023 | $2,771 | $221,650 | $86,400 | $135,250 |
| 2022 | $2,667 | $205,120 | $72,000 | $133,120 |
| 2021 | $2,282 | $175,560 | $53,090 | $122,470 |
| 2020 | $2,180 | $167,700 | $50,560 | $117,140 |
| 2019 | $2,000 | $153,810 | $50,560 | $103,250 |
| 2018 | $1,962 | $150,940 | $50,560 | $100,380 |
| 2017 | $1,900 | $146,160 | $50,560 | $95,600 |
| 2016 | $1,900 | $146,160 | $50,560 | $95,600 |
| 2015 | $1,900 | $146,160 | $50,560 | $95,600 |
| 2014 | $1,856 | $146,160 | $50,560 | $95,600 |
Source: Public Records
Map
Nearby Homes
- 3715 Magnolia Dr
- 3705 Bamboo Rd
- 3807 Springbloom Dr
- 3791 Towne Point Rd
- 3836 Old Farm Rd
- 3817 Harvest Ct
- 8110 Lee Hall Ave
- 3660B Towne Point Rd Unit A
- 5226 Moreland St
- 3913 Stateflower Ct
- 3877 Peachtree Ln W
- 3818 Peach Orchard Cir
- 2173 Humphreys Dr
- 3860 Sugar Creek Cir
- 3866 Augustine Cir
- 206 Rockwood Place
- 3604 Pierce St
- 6109 Compton Ct
- 6205 Dunkirk St
- 6015 Arthur Ave
- 3816 Red Barn Rd
- 3808 Red Barn Rd
- 3805 Magnolia Dr
- 3803 Magnolia Dr
- 3809 Red Barn Rd
- 3813 Red Barn Rd
- 3815 Towne Point Rd
- 3807 Magnolia Dr
- 3801 Magnolia Dr
- 3805 Red Barn Rd
- 3817 Red Barn Rd
- 3800 Red Barn Rd
- 3 Red Barn Ct
- 3801 Red Barn Rd
- 3809 Magnolia Dr
- 4 Red Barn Ct
- 3821 Red Barn Rd
- 4 Little Church Rd
- 3724 Red Barn Rd
- 3806 Magnolia Dr