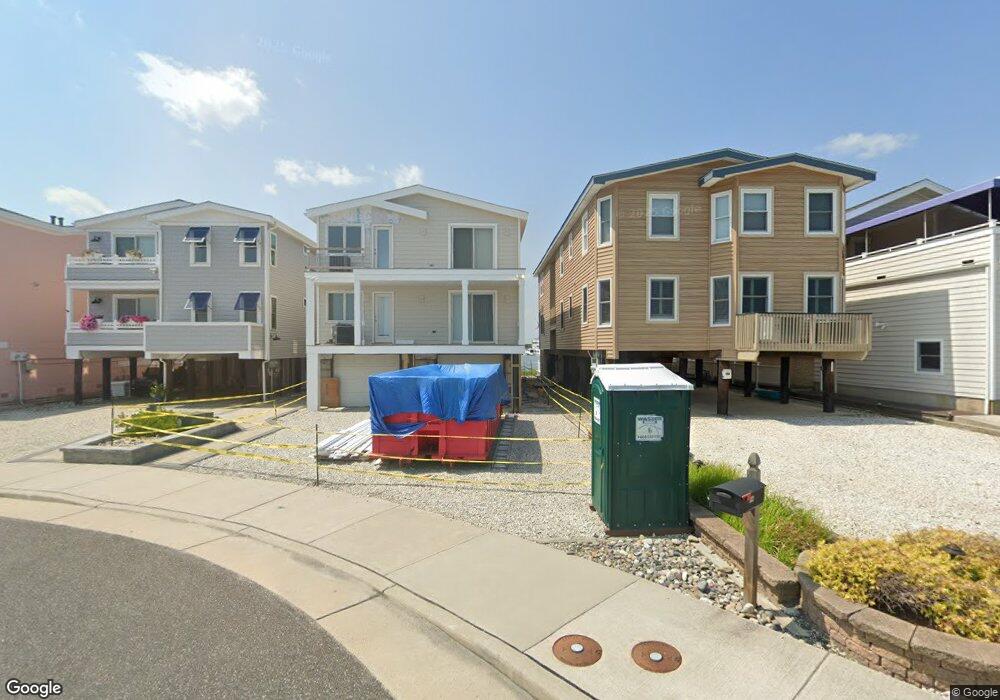
3812 Waterview Blvd Unit 14 Ocean City, NJ 08226
Estimated Value: $1,005,000 - $1,348,000
--
Bed
--
Bath
1,522
Sq Ft
$748/Sq Ft
Est. Value
About This Home
This home is located at 3812 Waterview Blvd Unit 14, Ocean City, NJ 08226 and is currently estimated at $1,139,100, approximately $748 per square foot. 3812 Waterview Blvd Unit 14 is a home located in Cape May County with nearby schools including Ocean City Primary School, Ocean City Intermediate School, and Ocean City High School.
Ownership History
Date
Name
Owned For
Owner Type
Purchase Details
Closed on
Jun 21, 2013
Sold by
Koren Joseph E and Koren Cheryl T
Bought by
Esterly Scott D and Esterly Theresa A
Current Estimated Value
Home Financials for this Owner
Home Financials are based on the most recent Mortgage that was taken out on this home.
Original Mortgage
$416,250
Outstanding Balance
$297,411
Interest Rate
3.59%
Mortgage Type
New Conventional
Estimated Equity
$841,689
Purchase Details
Closed on
Jul 7, 2006
Sold by
Tennant Koren Cheryl
Bought by
Tennant Koren Cheryl and Koren Joseph E
Purchase Details
Closed on
May 13, 2005
Sold by
Maron Manfred S and Maron Agnes P
Bought by
Maron Tennant Cheryl
Home Financials for this Owner
Home Financials are based on the most recent Mortgage that was taken out on this home.
Original Mortgage
$210,000
Interest Rate
5.95%
Mortgage Type
New Conventional
Purchase Details
Closed on
Jul 1, 1988
Sold by
Etling Robert
Bought by
Levy Steve
Create a Home Valuation Report for This Property
The Home Valuation Report is an in-depth analysis detailing your home's value as well as a comparison with similar homes in the area
Home Values in the Area
Average Home Value in this Area
Purchase History
| Date | Buyer | Sale Price | Title Company |
|---|---|---|---|
| Esterly Scott D | $555,000 | North American Title Agency | |
| Tennant Koren Cheryl | -- | None Available | |
| Maron Tennant Cheryl | $725,000 | -- | |
| Levy Steve | $274,000 | -- |
Source: Public Records
Mortgage History
| Date | Status | Borrower | Loan Amount |
|---|---|---|---|
| Open | Esterly Scott D | $416,250 | |
| Previous Owner | Maron Tennant Cheryl | $210,000 | |
| Closed | Maron Tennant Cheryl | $25,000 |
Source: Public Records
Tax History Compared to Growth
Tax History
| Year | Tax Paid | Tax Assessment Tax Assessment Total Assessment is a certain percentage of the fair market value that is determined by local assessors to be the total taxable value of land and additions on the property. | Land | Improvement |
|---|---|---|---|---|
| 2025 | $6,621 | $590,100 | $410,400 | $179,700 |
| 2024 | $6,621 | $590,100 | $410,400 | $179,700 |
| 2023 | $6,320 | $590,100 | $410,400 | $179,700 |
| 2022 | $6,072 | $590,100 | $410,400 | $179,700 |
| 2021 | $4,402 | $590,100 | $410,400 | $179,700 |
| 2020 | $5,771 | $590,100 | $410,400 | $179,700 |
| 2019 | $5,706 | $590,100 | $410,400 | $179,700 |
| 2018 | $5,653 | $590,100 | $410,400 | $179,700 |
| 2017 | $5,565 | $590,100 | $410,400 | $179,700 |
| 2016 | $5,352 | $590,100 | $410,400 | $179,700 |
| 2015 | $5,281 | $590,100 | $410,400 | $179,700 |
| 2014 | $5,205 | $590,100 | $410,400 | $179,700 |
Source: Public Records
Map
Nearby Homes
- 3708 Westminster Ln
- 103 Somerset Ln
- 215 Limpet Dr Unit 215
- 515 Conch Dr Unit 515 Conch
- 507 Conch Dr
- 3700 Oxford Ln
- 3604 Oxford Ln
- 17 36th St Unit 111
- 3551 Bay Ave Unit 34
- 3716 18 West Ave
- 3815 West Ave Unit 2nd floor
- 3813-15 West
- 3809 W #1 Ave Unit 1
- 3813 West Ave Unit 1st floor
- 3809 West Ave Unit 1
- 3827 Asbury Ave Unit 2
- 3649 West Ave Unit 1
- 4102 West Ave Unit 2
- 3432 Haven Ave Unit I
- 3313 Bay Ave
- 3812 Waterview Blvd Unit 1st Floor
- 3812 Waterview Blvd Unit 14
- 3808 Waterview Blvd Unit 10
- 3808 Waterview Blvd Unit 10
- 3816 Waterview Blvd Unit 1st floor
- 3816 Waterview Blvd Unit 18
- 3816 Waterview Blvd Unit 18
- 3804 Waterview Blvd Unit 6
- 3804 Waterview Blvd Unit 6
- 3802 Waterview Blvd Unit 2
- 3802 Waterview Blvd
- 3800 Waterview Blvd Unit 1
- 3800 Waterview Blvd Unit 2
- 3800 Waterview Blvd Unit 2
- 3820 Waterview Blvd Unit 22
- 3824 Waterview Blvd Unit 26
- 3824 Waterview Blvd Unit 26
- 304 Bayberry Ln Unit 304
- 3828 Waterview Blvd Unit 30
- 3828 Waterview Blvd Unit 30