Estimated Value: $202,021 - $291,000
3
Beds
3
Baths
2,014
Sq Ft
$130/Sq Ft
Est. Value
About This Home
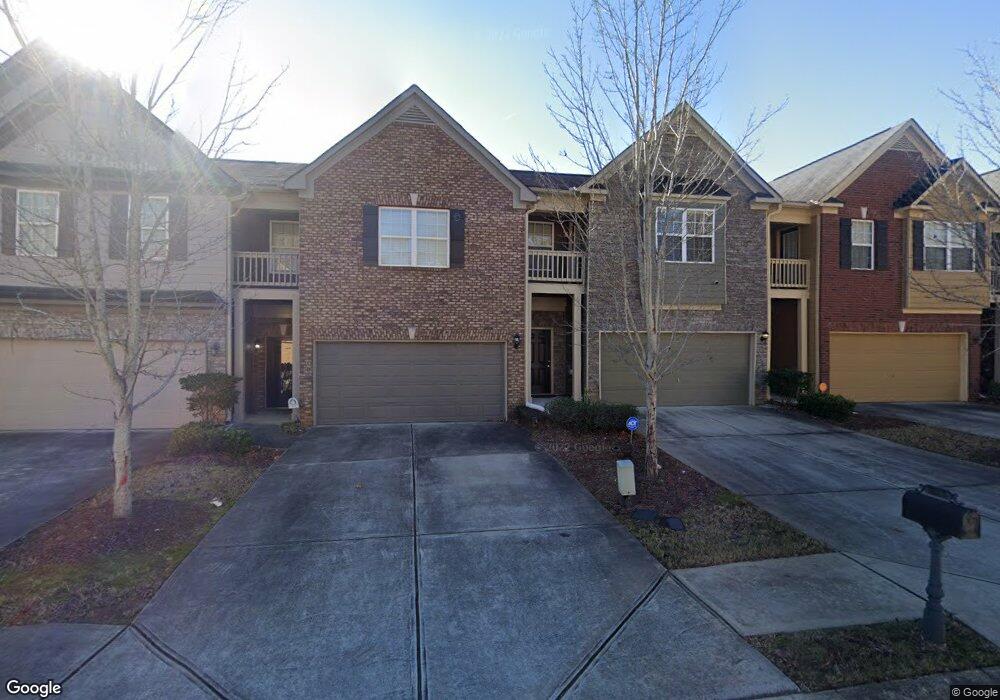
This home is located at 3813 Augustine Place, Rex, GA 30273 and is currently estimated at $261,255, approximately $129 per square foot. 3813 Augustine Place is a home located in Clayton County with nearby schools including Roberta T. Smith Elementary School, Rex Mill Middle School, and Morrow High School.
Ownership History
Date
Name
Owned For
Owner Type
Purchase Details
Closed on
Jul 22, 2016
Sold by
Us Rof Iii Lega Trust 2015 & 1
Bought by
Clark Crystal
Current Estimated Value
Home Financials for this Owner
Home Financials are based on the most recent Mortgage that was taken out on this home.
Original Mortgage
$106,043
Outstanding Balance
$85,660
Interest Rate
4.12%
Mortgage Type
FHA
Estimated Equity
$175,595
Purchase Details
Closed on
Feb 10, 2016
Sold by
Anderson Lashawnda
Bought by
Us Bank National Association Trustee and C/O Fay Servicing Llc
Purchase Details
Closed on
May 1, 2007
Sold by
Parkside Homes Inc
Bought by
Anderson Lashawanda
Home Financials for this Owner
Home Financials are based on the most recent Mortgage that was taken out on this home.
Original Mortgage
$157,545
Interest Rate
6.12%
Mortgage Type
New Conventional
Create a Home Valuation Report for This Property
The Home Valuation Report is an in-depth analysis detailing your home's value as well as a comparison with similar homes in the area
Home Values in the Area
Average Home Value in this Area
Purchase History
| Date | Buyer | Sale Price | Title Company |
|---|---|---|---|
| Clark Crystal | $108,000 | -- | |
| Us Bank National Association Trustee | -- | -- | |
| Anderson Lashawanda | $157,600 | -- |
Source: Public Records
Mortgage History
| Date | Status | Borrower | Loan Amount |
|---|---|---|---|
| Open | Clark Crystal | $106,043 | |
| Previous Owner | Anderson Lashawanda | $157,545 |
Source: Public Records
Tax History
| Year | Tax Paid | Tax Assessment Tax Assessment Total Assessment is a certain percentage of the fair market value that is determined by local assessors to be the total taxable value of land and additions on the property. | Land | Improvement |
|---|---|---|---|---|
| 2025 | $3,031 | $88,160 | $8,800 | $79,360 |
| 2024 | $3,120 | $89,000 | $8,800 | $80,200 |
| 2023 | $3,385 | $93,760 | $8,800 | $84,960 |
| 2022 | $2,622 | $75,840 | $8,800 | $67,040 |
| 2021 | $2,346 | $68,440 | $8,800 | $59,640 |
| 2020 | $2,206 | $64,219 | $8,800 | $55,419 |
| 2019 | $1,919 | $56,335 | $7,200 | $49,135 |
| 2018 | $1,844 | $54,488 | $7,200 | $47,288 |
| 2017 | $1,311 | $41,284 | $7,200 | $34,084 |
| 2016 | $1,404 | $33,564 | $7,200 | $26,364 |
| 2015 | $981 | $0 | $0 | $0 |
| 2014 | $882 | $31,202 | $7,200 | $24,002 |
Source: Public Records
Map
Nearby Homes
- 3824 Augustine Place
- 6661 Highway 42
- 6435 Cumberland Dr
- 6670 Sunset Hills Blvd
- 6814 Biscayne
- 3769 Brookwood Blvd
- 6667 Sunset Park Unit III
- 6683 Homestead Rd
- 6708 Sunset Hills Blvd
- 6702 Saganaw Dr
- 6746 Sunset Hills Blvd
- 6750 Sunset Hills Blvd
- 6608 Chesepeake Trail
- 6604 Chesepeake Trail
- 85 Homestead Place
- 3712 Skyline Place
- 100 Homestead Place
- 6737 Biscayne Blvd
- 6773 Biscayne Blvd
- 0 Lakeland Rd Unit 7648836
- 3815 Augustine Place
- 3815 Augustine Place
- 3811 Augustine Place
- 3809 Augustine Place
- 3817 Augustine Place
- 3807 Augustine Place
- 3805 Augustine Place Unit 122
- 3805 Augustine Place
- 3821 Augustine Place
- 3803 Augustine Place
- 3823 Augustine Place
- 3825 Augustine Place
- 3801 Augustine Place
- 3801 Augustine Place Unit 3801
- 3816 Augustine Place
- 3816 Augustine Place
- 3814 Augustine Place
- 3818 Augustine Place
- 3812 Augustine Place
- 0 Augustine Place Unit 8826714
Your Personal Tour Guide
Ask me questions while you tour the home.