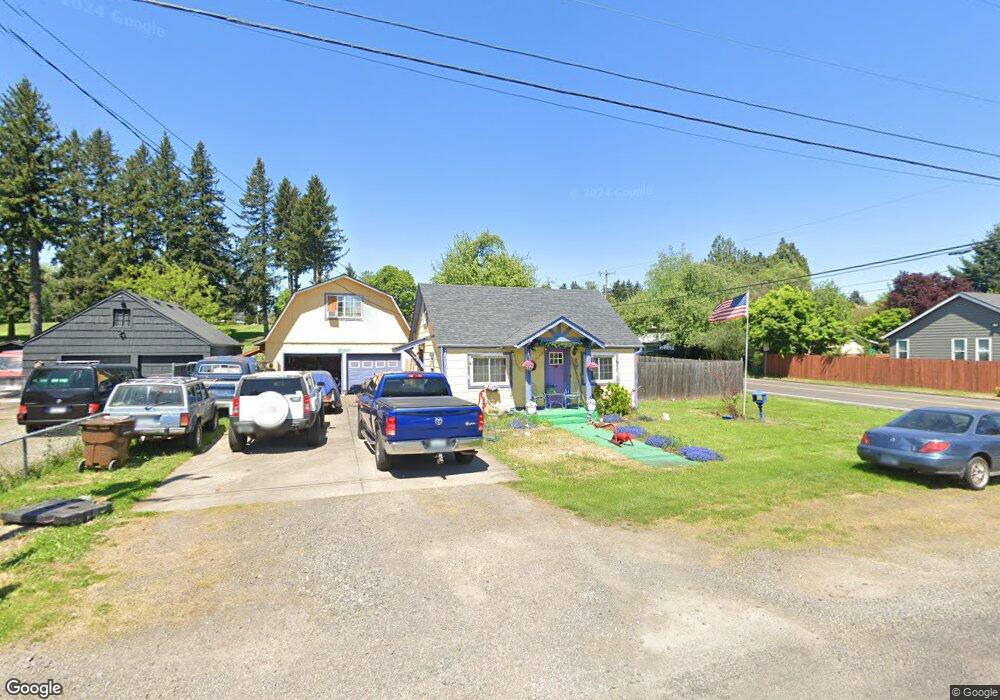
3813 C St Washougal, WA 98671
Estimated Value: $330,000 - $392,000
1
Bed
1
Bath
1,196
Sq Ft
$309/Sq Ft
Est. Value
About This Home
This home is located at 3813 C St, Washougal, WA 98671 and is currently estimated at $369,068, approximately $308 per square foot. 3813 C St is a home located in Clark County with nearby schools including Columbia River Gorge Elementary School, Jemtegaard Middle School, and Washougal High School.
Ownership History
Date
Name
Owned For
Owner Type
Purchase Details
Closed on
Jan 27, 2016
Sold by
Faley Jacquelyn and Faley Arnold F
Bought by
Laddusaw Gary and Laddusaw Susan
Current Estimated Value
Home Financials for this Owner
Home Financials are based on the most recent Mortgage that was taken out on this home.
Original Mortgage
$180,258
Outstanding Balance
$143,652
Interest Rate
3.94%
Mortgage Type
VA
Estimated Equity
$225,416
Purchase Details
Closed on
Jan 23, 2012
Sold by
Nylund Homes Inc
Bought by
Faley Jacquelyn and Faley Arnold
Purchase Details
Closed on
Jan 6, 2012
Sold by
Harnden Michael R
Bought by
Nylund Homes Inc
Purchase Details
Closed on
Mar 27, 1998
Sold by
Kenyon Doyle E and Kenyon Patricia R
Bought by
Harnden Michael R
Home Financials for this Owner
Home Financials are based on the most recent Mortgage that was taken out on this home.
Original Mortgage
$57,000
Interest Rate
7%
Create a Home Valuation Report for This Property
The Home Valuation Report is an in-depth analysis detailing your home's value as well as a comparison with similar homes in the area
Home Values in the Area
Average Home Value in this Area
Purchase History
| Date | Buyer | Sale Price | Title Company |
|---|---|---|---|
| Laddusaw Gary | $175,000 | Stewart Title Vancouver | |
| Faley Jacquelyn | $75,000 | Columbia Title Agency | |
| Nylund Homes Inc | $59,101 | Columbia Title | |
| Harnden Michael R | $60,000 | Chicago Title Insurance Co |
Source: Public Records
Mortgage History
| Date | Status | Borrower | Loan Amount |
|---|---|---|---|
| Open | Laddusaw Gary | $180,258 | |
| Previous Owner | Harnden Michael R | $57,000 |
Source: Public Records
Tax History Compared to Growth
Tax History
| Year | Tax Paid | Tax Assessment Tax Assessment Total Assessment is a certain percentage of the fair market value that is determined by local assessors to be the total taxable value of land and additions on the property. | Land | Improvement |
|---|---|---|---|---|
| 2025 | $2,928 | $274,601 | $116,295 | $158,306 |
| 2024 | $2,835 | $308,260 | $160,487 | $147,773 |
| 2023 | $2,742 | $312,213 | $160,487 | $151,726 |
| 2022 | $2,771 | $295,790 | $153,509 | $142,281 |
| 2021 | $2,631 | $259,506 | $134,902 | $124,604 |
| 2020 | $2,399 | $231,292 | $122,110 | $109,182 |
| 2019 | $1,960 | $214,220 | $116,295 | $97,925 |
| 2018 | $2,292 | $185,023 | $0 | $0 |
| 2017 | $1,859 | $178,631 | $0 | $0 |
| 2016 | $1,753 | $159,073 | $0 | $0 |
| 2015 | $1,643 | $137,119 | $0 | $0 |
| 2014 | -- | $127,908 | $0 | $0 |
| 2013 | -- | $113,635 | $0 | $0 |
Source: Public Records
Map
Nearby Homes
- 3600 A St Unit 6
- 4309 C St
- 3777 Addy St Unit 56
- 3777 Addy St Unit 12
- 3777 Addy St Unit 16
- 4363 Addy Loop
- 1002 40th St
- 1061 40th St
- 4202 L Cir
- 4501 Addy St Unit 91
- 4501 Addy St Unit 121
- 4501 Addy St Unit 30
- 4501 Addy St Unit 101
- 4501 Addy St Unit 67
- 3301 K St
- 2905 Main St
- 2887 E St
- 698 51st St
- 2835 E St
- 4209 P St