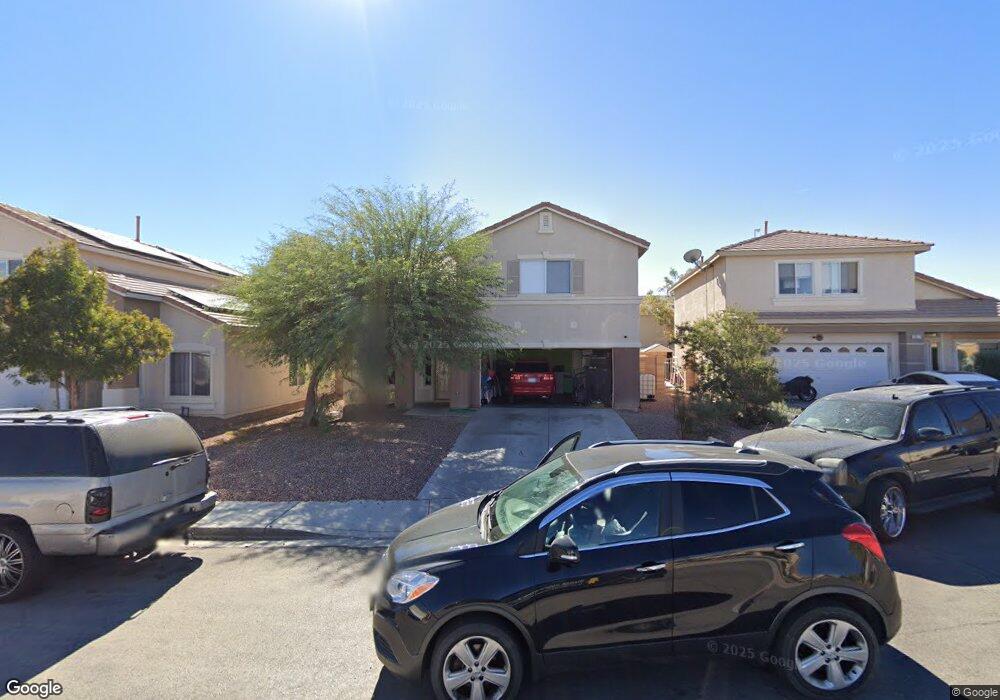
3813 Nestled Oak Ave Unit 6 North Las Vegas, NV 89031
Craig Ranch NeighborhoodEstimated Value: $403,000 - $453,000
4
Beds
3
Baths
1,946
Sq Ft
$220/Sq Ft
Est. Value
About This Home
This home is located at 3813 Nestled Oak Ave Unit 6, North Las Vegas, NV 89031 and is currently estimated at $428,546, approximately $220 per square foot. 3813 Nestled Oak Ave Unit 6 is a home located in Clark County with nearby schools including Goynes Elementary School, Brian & Teri Cram Middle School, and Shadow Ridge High School.
Ownership History
Date
Name
Owned For
Owner Type
Purchase Details
Closed on
Nov 1, 2010
Sold by
The Bank Of New York Mellon
Bought by
Fortune Real Estate Ut 888 Llc
Current Estimated Value
Purchase Details
Closed on
Feb 3, 2010
Sold by
The Bank Of New York Mellon
Bought by
Federal Home Loan Mortgage Corp
Purchase Details
Closed on
Nov 2, 2005
Sold by
Mouaki Benani Zehour
Bought by
Mouaki Benani Zoubir
Home Financials for this Owner
Home Financials are based on the most recent Mortgage that was taken out on this home.
Original Mortgage
$210,000
Interest Rate
1.5%
Mortgage Type
Negative Amortization
Purchase Details
Closed on
Dec 11, 2001
Sold by
Hh Res Llc
Bought by
Mouaki Benani Djamel
Home Financials for this Owner
Home Financials are based on the most recent Mortgage that was taken out on this home.
Original Mortgage
$145,650
Interest Rate
6.57%
Create a Home Valuation Report for This Property
The Home Valuation Report is an in-depth analysis detailing your home's value as well as a comparison with similar homes in the area
Home Values in the Area
Average Home Value in this Area
Purchase History
| Date | Buyer | Sale Price | Title Company |
|---|---|---|---|
| Fortune Real Estate Ut 888 Llc | $100,000 | First American Title Paseo | |
| Federal Home Loan Mortgage Corp | $117,000 | First American National Def | |
| The Bank Of New York Mellon | $117,000 | First American National Def | |
| Mouaki Benani Zoubir | -- | Old Republic Title Co Of Nv | |
| Mouaki Benani Zoubir | $300,000 | Old Republic Title Co Of Nv | |
| Mouaki Benani Djamel | $153,322 | United Title |
Source: Public Records
Mortgage History
| Date | Status | Borrower | Loan Amount |
|---|---|---|---|
| Previous Owner | Mouaki Benani Zoubir | $210,000 | |
| Previous Owner | Mouaki Benani Djamel | $145,650 |
Source: Public Records
Tax History Compared to Growth
Tax History
| Year | Tax Paid | Tax Assessment Tax Assessment Total Assessment is a certain percentage of the fair market value that is determined by local assessors to be the total taxable value of land and additions on the property. | Land | Improvement |
|---|---|---|---|---|
| 2025 | $1,968 | $103,808 | $33,250 | $70,558 |
| 2024 | $1,823 | $103,808 | $33,250 | $70,558 |
| 2023 | $1,823 | $96,896 | $30,100 | $66,796 |
| 2022 | $1,688 | $86,592 | $25,550 | $61,042 |
| 2021 | $1,563 | $80,844 | $22,750 | $58,094 |
| 2020 | $1,449 | $79,330 | $21,700 | $57,630 |
| 2019 | $1,354 | $75,375 | $18,900 | $56,475 |
| 2018 | $1,292 | $68,750 | $14,700 | $54,050 |
| 2017 | $2,209 | $65,840 | $13,300 | $52,540 |
| 2016 | $1,210 | $55,226 | $8,750 | $46,476 |
| 2015 | $1,207 | $42,578 | $7,000 | $35,578 |
| 2014 | $1,169 | $33,814 | $7,000 | $26,814 |
Source: Public Records
Map
Nearby Homes
- 6103 Harvest Dance St
- 3821 Champagne Wood Dr
- 3605 Sapphire Sea Ct
- 3604 Sandy Brown Ave
- 6314 Ruby Cedar Ct
- 4025 Fairywren Dr
- 3513 Mastercraft Ave
- 6314 Shadow Moon Place
- 3729 Shimmering Creek Ave
- 5923 Sunrise Creek St
- 3509 Red Fire Ave
- 6032 Glitter Gold Ct
- 6334 Orions Belt Peak St
- 3405 Red Fire Ave
- 6223 Orions Belt Peak St
- 4050 Midnight Crest Ave
- 6133 Turaco St
- 4145 Midnight Crest Ave
- 5845 Gentle Creek Ln
- 3217 Palladio Ave
- 3809 Nestled Oak Ave
- 3809 Nestled Oak Ave
- 3809 Nestled Oak Ave
- 3817 Nestled Oak Ave
- 3805 Nestled Oak Ave
- 3810 Lillian Wood Ave
- 3814 Lillian Wood Ave
- 3806 Lillian Wood Ave
- 3801 Nestled Oak Ave
- 3821 Nestled Oak Ave Unit 6
- 3810 Nestled Oak Ave Unit 6
- 3818 Lillian Wood Ave
- 3806 Nestled Oak Ave
- 3802 Lillian Wood Ave Unit 4
- 6133 Morning Wing Dr
- 3802 Nestled Oak Ave
- 3729 Nestled Oak Ave
- 6137 Morning Wing Dr
- 3728 Lillian Wood Ave
- 3850 China Cloud Dr