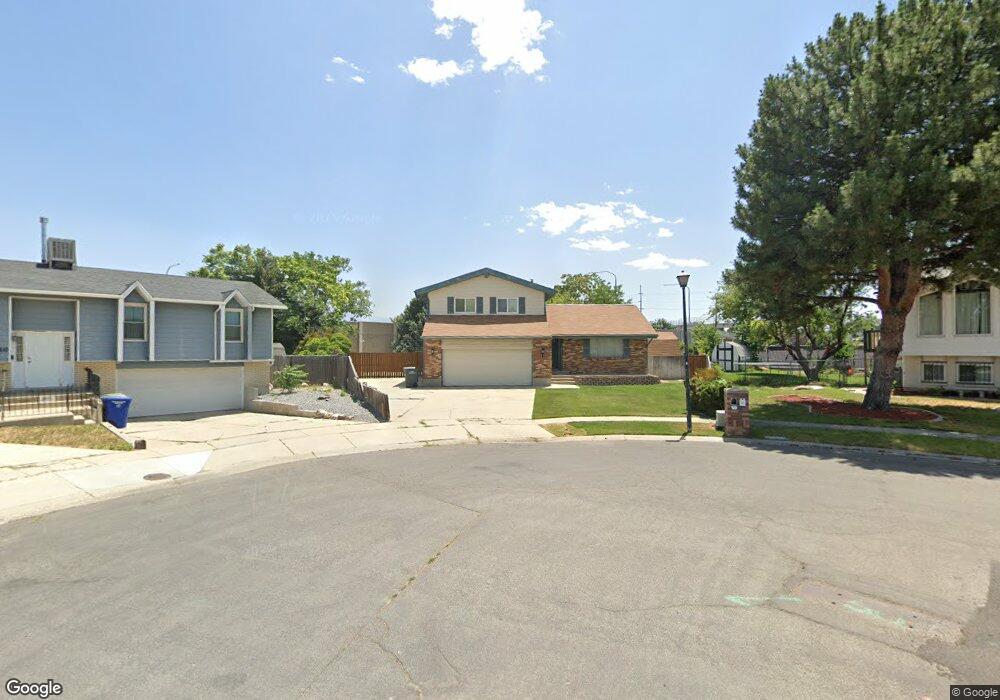
3813 Pinehurst Cir Salt Lake City, UT 84120
Granger NeighborhoodEstimated Value: $455,401 - $642,000
6
Beds
3
Baths
2,040
Sq Ft
$252/Sq Ft
Est. Value
About This Home
This home is located at 3813 Pinehurst Cir, Salt Lake City, UT 84120 and is currently estimated at $514,100, approximately $252 per square foot. 3813 Pinehurst Cir is a home located in Salt Lake County with nearby schools including Pioneer Elementary School, Valley Junior High School, and Granger High School.
Ownership History
Date
Name
Owned For
Owner Type
Purchase Details
Closed on
Jan 8, 2009
Sold by
Swallom Devan and Swallom Amie L
Bought by
Swallom Amie L
Current Estimated Value
Purchase Details
Closed on
Sep 4, 2003
Sold by
Swallom Devan D and Swallom Amie L
Bought by
Swallom Devan D and Swallom Amie L
Purchase Details
Closed on
Feb 23, 2003
Sold by
Countrywide Home Loans Inc
Bought by
Hud
Purchase Details
Closed on
Jan 14, 2003
Sold by
Venegas Jose and Venegas Jose A
Bought by
Countrywide Home Loans Inc
Purchase Details
Closed on
Jan 10, 2001
Sold by
Harris Corey J and Alese Harris J
Bought by
Venegas Jose and Venegas Jose A
Home Financials for this Owner
Home Financials are based on the most recent Mortgage that was taken out on this home.
Original Mortgage
$143,867
Interest Rate
7.65%
Mortgage Type
FHA
Create a Home Valuation Report for This Property
The Home Valuation Report is an in-depth analysis detailing your home's value as well as a comparison with similar homes in the area
Home Values in the Area
Average Home Value in this Area
Purchase History
| Date | Buyer | Sale Price | Title Company |
|---|---|---|---|
| Swallom Amie L | -- | None Available | |
| Swallom Devan D | -- | Us Title Of Utah | |
| Swallom Devon D | -- | Us Title Of Utah | |
| Hud | -- | First American Title | |
| Countrywide Home Loans Inc | $156,013 | First American Title | |
| Venegas Jose | -- | Guardian Title |
Source: Public Records
Mortgage History
| Date | Status | Borrower | Loan Amount |
|---|---|---|---|
| Previous Owner | Venegas Jose | $143,867 |
Source: Public Records
Tax History Compared to Growth
Tax History
| Year | Tax Paid | Tax Assessment Tax Assessment Total Assessment is a certain percentage of the fair market value that is determined by local assessors to be the total taxable value of land and additions on the property. | Land | Improvement |
|---|---|---|---|---|
| 2025 | $2,623 | $451,300 | $108,200 | $343,100 |
| 2024 | $2,623 | $401,800 | $99,300 | $302,500 |
| 2023 | $2,696 | $395,500 | $95,400 | $300,100 |
| 2022 | $2,582 | $379,700 | $93,600 | $286,100 |
| 2021 | $2,260 | $298,700 | $72,000 | $226,700 |
| 2020 | $2,101 | $262,100 | $65,000 | $197,100 |
| 2019 | $2,129 | $256,200 | $61,300 | $194,900 |
| 2018 | $2,032 | $235,600 | $61,300 | $174,300 |
| 2017 | $1,783 | $210,300 | $61,300 | $149,000 |
| 2016 | $1,518 | $179,400 | $61,300 | $118,100 |
| 2015 | $1,364 | $153,500 | $65,600 | $87,900 |
| 2014 | $1,329 | $146,500 | $63,400 | $83,100 |
Source: Public Records
Map
Nearby Homes
- 3843 W 4100 S
- 3818 W Edgewater Cir
- 3664 W 3965 S
- 3916 S Hawkeye St
- 3741 W 3830 S
- 4278 S 3720 W
- 4014 S Peachwood Dr
- 4123 W 3980 S
- 3574 W Meadowbrook Dr
- 4093 Peachwood Dr
- 3503 W Paiute Dr
- 4171 S 4205 W
- 4080 S Bonniewood Dr
- 4389 S 3760 W
- 3376 Sunnybrook Dr
- 3780 S 3520 W
- 4208 S 4205 W
- 4392 S 3680 W
- 4209 W 3860 S
- 3308 W 4060 S
- 3823 W Pinehurst Cir
- 3823 Pinehurst Cir
- 3810 W Pinehurst Cir
- 3810 Pinehurst Cir
- 3833 Pinehurst Cir
- 3818 W Pinehurst Cir
- 3818 Pinehurst Cir
- 3826 W Pinehurst Cir
- 3826 Pinehurst Cir
- 3843 W Pinehurst Cir
- 4058 Carrie Dr
- 4052 Carrie Dr
- 3843 Pinehurst Cir
- 3836 Pinehurst Cir
- 4066 Carrie Dr
- 4044 Carrie Dr
- 4052 S Carrie Dr
- 3819 Sweetwater Cir
- 3813 W Sweetwater Cir
- 4044 S Carrie Dr