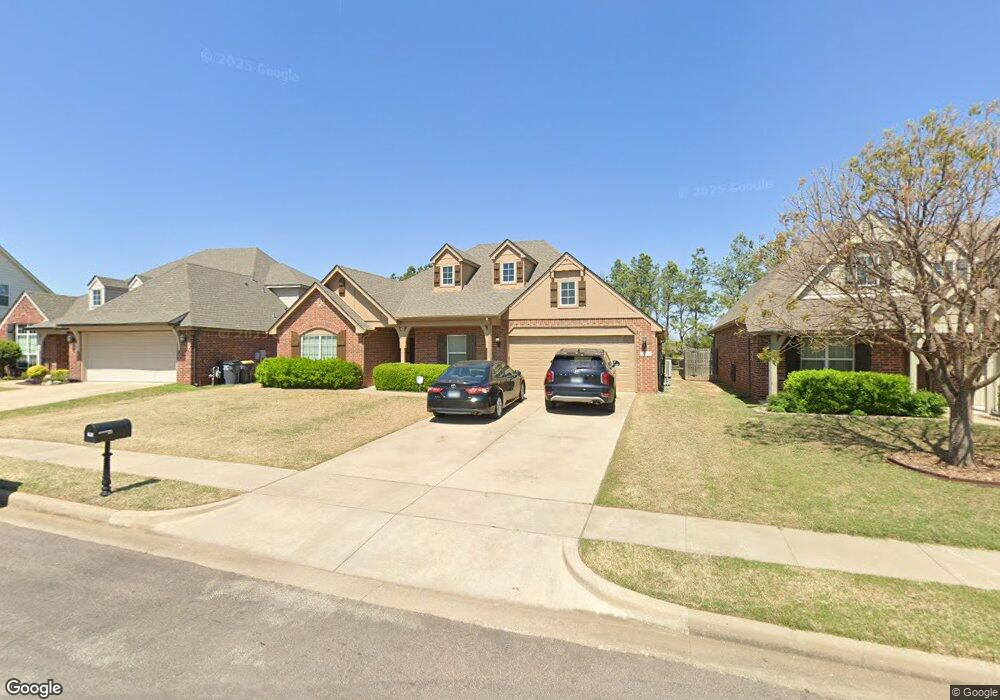
3813 W 106th St S Sapulpa, OK 74066
Estimated Value: $329,725 - $344,000
--
Bed
2
Baths
1,967
Sq Ft
$171/Sq Ft
Est. Value
About This Home
This home is located at 3813 W 106th St S, Sapulpa, OK 74066 and is currently estimated at $335,931, approximately $170 per square foot. 3813 W 106th St S is a home located in Tulsa County with nearby schools including Jenks West Elementary School, Jenks West Intermediate Elementary School, and Jenks Middle School.
Ownership History
Date
Name
Owned For
Owner Type
Purchase Details
Closed on
Aug 10, 2017
Bought by
Hardt John E
Current Estimated Value
Home Financials for this Owner
Home Financials are based on the most recent Mortgage that was taken out on this home.
Original Mortgage
$216,047
Outstanding Balance
$179,982
Interest Rate
3.9%
Estimated Equity
$155,949
Purchase Details
Closed on
Jul 30, 2014
Sold by
Lottman Chris W and Lottman Sarah M
Bought by
Hook Jeffrey
Purchase Details
Closed on
Jun 24, 2009
Sold by
Simmons Homes Residential Group Llc
Bought by
Lottman Chris W and Lottman Sarah M
Home Financials for this Owner
Home Financials are based on the most recent Mortgage that was taken out on this home.
Original Mortgage
$201,718
Interest Rate
4.97%
Mortgage Type
FHA
Create a Home Valuation Report for This Property
The Home Valuation Report is an in-depth analysis detailing your home's value as well as a comparison with similar homes in the area
Home Values in the Area
Average Home Value in this Area
Purchase History
| Date | Buyer | Sale Price | Title Company |
|---|---|---|---|
| Hardt John E | $211,500 | -- | |
| Hook Jeffrey | $192,000 | None Available | |
| Lottman Chris W | $205,500 | Executives Title & Escrow Co |
Source: Public Records
Mortgage History
| Date | Status | Borrower | Loan Amount |
|---|---|---|---|
| Open | Hardt John E | $216,047 | |
| Closed | Hardt John E | -- | |
| Previous Owner | Lottman Chris W | $201,718 |
Source: Public Records
Tax History Compared to Growth
Tax History
| Year | Tax Paid | Tax Assessment Tax Assessment Total Assessment is a certain percentage of the fair market value that is determined by local assessors to be the total taxable value of land and additions on the property. | Land | Improvement |
|---|---|---|---|---|
| 2024 | $3,015 | $24,423 | $3,383 | $21,040 |
| 2023 | $3,015 | $24,682 | $3,653 | $21,029 |
| 2022 | $2,952 | $22,963 | $4,343 | $18,620 |
| 2021 | $2,899 | $22,265 | $4,211 | $18,054 |
| 2020 | $2,835 | $22,265 | $4,211 | $18,054 |
| 2019 | $2,855 | $22,265 | $4,211 | $18,054 |
| 2018 | $2,874 | $22,265 | $4,211 | $18,054 |
| 2017 | $2,682 | $21,120 | $4,400 | $16,720 |
| 2016 | $2,748 | $21,120 | $4,400 | $16,720 |
| 2015 | $2,800 | $21,120 | $4,400 | $16,720 |
| 2014 | $2,929 | $22,605 | $4,400 | $18,205 |
Source: Public Records
Map
Nearby Homes
- 3706 W 106th St S
- 10910 S Olmsted St
- 3710 W 110th St S
- 10417 S 33rd West Ave
- 10732 S 33rd West Ave
- 10317 S Nathan St
- 10739 Masters Cir
- 11009 Augusta Dr
- 11275 S Douglas Ave
- 2957 W 114th Place S
- 11602 S 30th West Ave
- 11608 S Union Ave
- 2629 W 115th St S
- 9435 S 33rd West Ave
- 9333 S 33rd West Ave
- 2012 W 109th St S
- 11710 S Willow Place
- 2428 W C St
- 11206 S Redbud St
- 11728 S Willow Place
- 3811 W 106th St S
- 3809 W 106th St S
- 3815 W 106th St S
- 1037 S Nathan St
- 10611 S Nathan St
- 10611 S Nathan St
- 10606 S Nathan St
- 10613 S Nathan St
- 10615 S Nathan St
- 10606 S Madison St
- 10606 S Madison St
- 3803 W 106th St S
- 10608 S Madison St
- 10615 S Nathan St
- 10606 S Nathan St
- 10608 S Nathan St
- 10608 S Nathan St
- 3719 W 106th St S
- 10610 S Madison St
- 10611 S Madison St