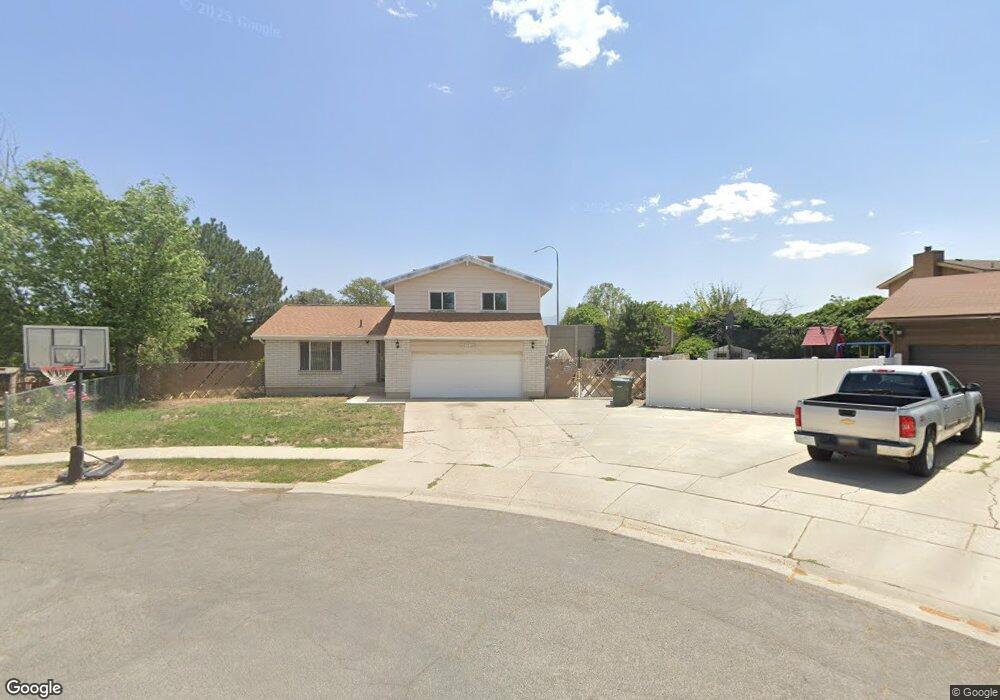
3813 Whitebird Cir Salt Lake City, UT 84120
Granger NeighborhoodEstimated Value: $464,974 - $593,000
5
Beds
4
Baths
1,875
Sq Ft
$268/Sq Ft
Est. Value
About This Home
This home is located at 3813 Whitebird Cir, Salt Lake City, UT 84120 and is currently estimated at $502,744, approximately $268 per square foot. 3813 Whitebird Cir is a home located in Salt Lake County with nearby schools including Pioneer Elementary School, Valley Junior High School, and Granger High School.
Ownership History
Date
Name
Owned For
Owner Type
Purchase Details
Closed on
Apr 10, 2018
Sold by
Te O Toeae
Bought by
Teo Toeae and Milford Mani S
Current Estimated Value
Purchase Details
Closed on
May 7, 2012
Sold by
Teo Toeae
Bought by
Te O Tocae
Purchase Details
Closed on
May 29, 1998
Sold by
Saena Vaalele T and Saena Nofoalii
Bought by
Teo Francis L
Home Financials for this Owner
Home Financials are based on the most recent Mortgage that was taken out on this home.
Original Mortgage
$138,500
Interest Rate
7.1%
Mortgage Type
Purchase Money Mortgage
Purchase Details
Closed on
Dec 8, 1993
Sold by
Ashe Donna
Bought by
Saena Vaalele T and Saena Nofoalii
Home Financials for this Owner
Home Financials are based on the most recent Mortgage that was taken out on this home.
Original Mortgage
$91,800
Interest Rate
6.89%
Mortgage Type
Purchase Money Mortgage
Create a Home Valuation Report for This Property
The Home Valuation Report is an in-depth analysis detailing your home's value as well as a comparison with similar homes in the area
Home Values in the Area
Average Home Value in this Area
Purchase History
| Date | Buyer | Sale Price | Title Company |
|---|---|---|---|
| Teo Toeae | -- | None Available | |
| Te O Tocae | -- | None Available | |
| Teo Francis L | -- | -- | |
| Saena Vaalele T | -- | -- |
Source: Public Records
Mortgage History
| Date | Status | Borrower | Loan Amount |
|---|---|---|---|
| Previous Owner | Teo Francis L | $138,500 | |
| Previous Owner | Saena Vaalele T | $91,800 |
Source: Public Records
Tax History Compared to Growth
Tax History
| Year | Tax Paid | Tax Assessment Tax Assessment Total Assessment is a certain percentage of the fair market value that is determined by local assessors to be the total taxable value of land and additions on the property. | Land | Improvement |
|---|---|---|---|---|
| 2025 | $2,324 | $412,600 | $106,200 | $306,400 |
| 2024 | $2,324 | $356,100 | $97,400 | $258,700 |
| 2023 | $2,524 | $370,200 | $93,600 | $276,600 |
| 2022 | $2,384 | $350,600 | $91,800 | $258,800 |
| 2021 | $2,023 | $267,400 | $70,600 | $196,800 |
| 2020 | $1,969 | $245,600 | $63,700 | $181,900 |
| 2019 | $2,037 | $245,100 | $60,100 | $185,000 |
| 2018 | $1,944 | $225,400 | $60,100 | $165,300 |
| 2017 | $1,712 | $202,000 | $60,100 | $141,900 |
| 2016 | $1,455 | $171,900 | $60,100 | $111,800 |
| 2015 | $1,326 | $149,200 | $64,300 | $84,900 |
| 2014 | $1,290 | $142,200 | $62,200 | $80,000 |
Source: Public Records
Map
Nearby Homes
- 3818 W Edgewater Cir
- 3664 W 3965 S
- 3916 S Hawkeye St
- 3843 W 4100 S
- 3741 W 3830 S
- 4014 S Peachwood Dr
- 4123 W 3980 S
- 3780 S 3520 W
- 4093 Peachwood Dr
- 4278 S 3720 W
- 4209 W 3860 S
- 3574 W Meadowbrook Dr
- 3503 W Paiute Dr
- 4080 S Bonniewood Dr
- 4171 S 4205 W
- 3376 Sunnybrook Dr
- 3761 S Oxford Way
- 3533 W 3650 S Unit 3535
- 4308 W Volta Ave
- 3308 W 4060 S
- 3819 Whitebird Cir
- 3812 W Whitebird Cir
- 3816 Sweetwater Cir
- 3812 Whitebird Cir
- 3812 Sweetwater Cir
- 3818 Whitebird Cir
- 3826 W Sweetwater Cir
- 3831 Whitebird Cir
- 3826 Sweetwater Cir
- 3812 W Sweetwater Cir
- 3828 W 3975 S
- 3828 Whitebird Cir
- 3817 W Edgewater Cir
- 3817 Edgewater Cir
- 3838 Sweetwater Cir
- 3980 Kewanee Dr
- 3995 Hawkeye Dr
- 3986 Kewanee Dr
- 3813 W Edgewater Cir
- 3977 Hawkeye Dr