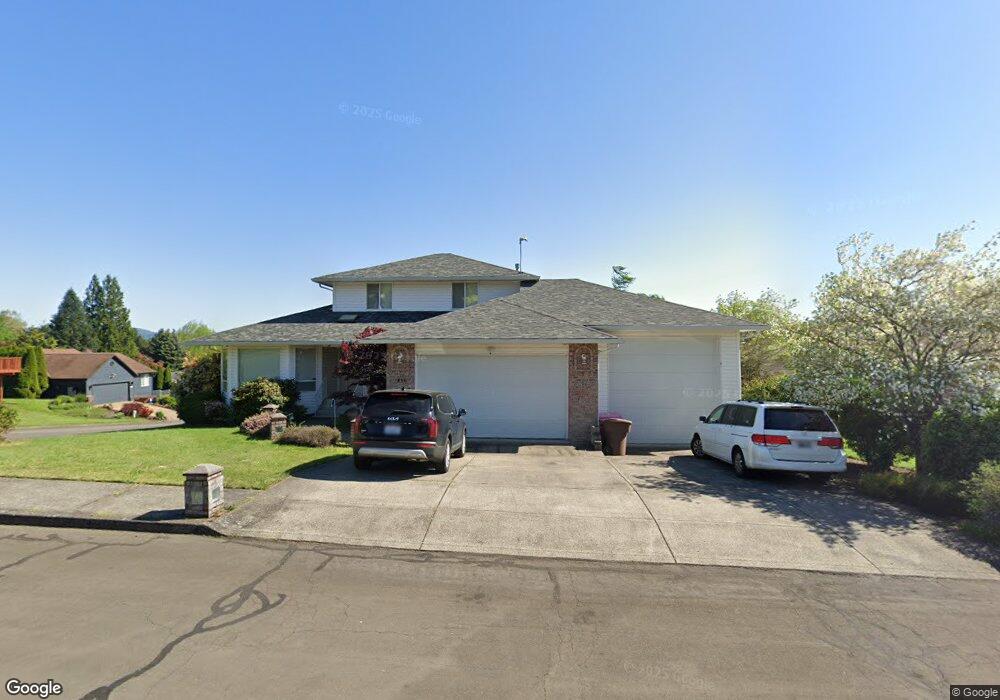
3814 T Cir Washougal, WA 98671
Estimated Value: $697,000 - $742,539
3
Beds
4
Baths
3,281
Sq Ft
$218/Sq Ft
Est. Value
About This Home
This home is located at 3814 T Cir, Washougal, WA 98671 and is currently estimated at $716,885, approximately $218 per square foot. 3814 T Cir is a home located in Clark County with nearby schools including Gause Elementary School, Jemtegaard Middle School, and Washougal High School.
Ownership History
Date
Name
Owned For
Owner Type
Purchase Details
Closed on
Jun 6, 2025
Sold by
Carroll Martha B
Bought by
Odenthal John Michael and Odenthal Susan M
Current Estimated Value
Purchase Details
Closed on
Nov 7, 2022
Sold by
Myers Grant K
Bought by
Carroll Martha B
Purchase Details
Closed on
Apr 17, 2018
Sold by
Myers Grant K and Myers Janet M
Bought by
Myers Grant K
Home Financials for this Owner
Home Financials are based on the most recent Mortgage that was taken out on this home.
Original Mortgage
$273,710
Interest Rate
4.45%
Mortgage Type
New Conventional
Purchase Details
Closed on
Apr 23, 2017
Sold by
Krohn Charles E and Krohn Gayle H
Bought by
Myers Grant K and Myers Janet M
Home Financials for this Owner
Home Financials are based on the most recent Mortgage that was taken out on this home.
Original Mortgage
$120,000
Interest Rate
4.3%
Mortgage Type
New Conventional
Create a Home Valuation Report for This Property
The Home Valuation Report is an in-depth analysis detailing your home's value as well as a comparison with similar homes in the area
Home Values in the Area
Average Home Value in this Area
Purchase History
| Date | Buyer | Sale Price | Title Company |
|---|---|---|---|
| Odenthal John Michael | $313 | None Listed On Document | |
| Carroll Martha B | -- | Wfg National Title | |
| Myers Grant K | -- | Title Source Inc | |
| Myers Grant K | $420,000 | Chicago Title Fl Vancouver |
Source: Public Records
Mortgage History
| Date | Status | Borrower | Loan Amount |
|---|---|---|---|
| Previous Owner | Myers Grant K | $273,710 | |
| Previous Owner | Myers Grant K | $120,000 |
Source: Public Records
Tax History Compared to Growth
Tax History
| Year | Tax Paid | Tax Assessment Tax Assessment Total Assessment is a certain percentage of the fair market value that is determined by local assessors to be the total taxable value of land and additions on the property. | Land | Improvement |
|---|---|---|---|---|
| 2025 | $5,854 | $624,916 | $135,000 | $489,916 |
| 2024 | $5,664 | $617,279 | $159,000 | $458,279 |
| 2023 | $5,585 | $625,093 | $169,800 | $455,293 |
| 2022 | $5,569 | $603,523 | $169,800 | $433,723 |
| 2021 | $5,359 | $522,245 | $147,000 | $375,245 |
| 2020 | $5,153 | $471,529 | $135,000 | $336,529 |
| 2019 | $4,681 | $460,550 | $135,000 | $325,550 |
| 2018 | $5,097 | $442,369 | $0 | $0 |
| 2017 | $4,405 | $397,516 | $0 | $0 |
| 2016 | $4,211 | $377,404 | $0 | $0 |
| 2015 | $4,145 | $329,901 | $0 | $0 |
| 2014 | -- | $323,094 | $0 | $0 |
| 2013 | -- | $208,596 | $0 | $0 |
Source: Public Records
Map
Nearby Homes