Estimated Value: $196,000 - $249,000
3
Beds
2
Baths
1,152
Sq Ft
$199/Sq Ft
Est. Value
About This Home
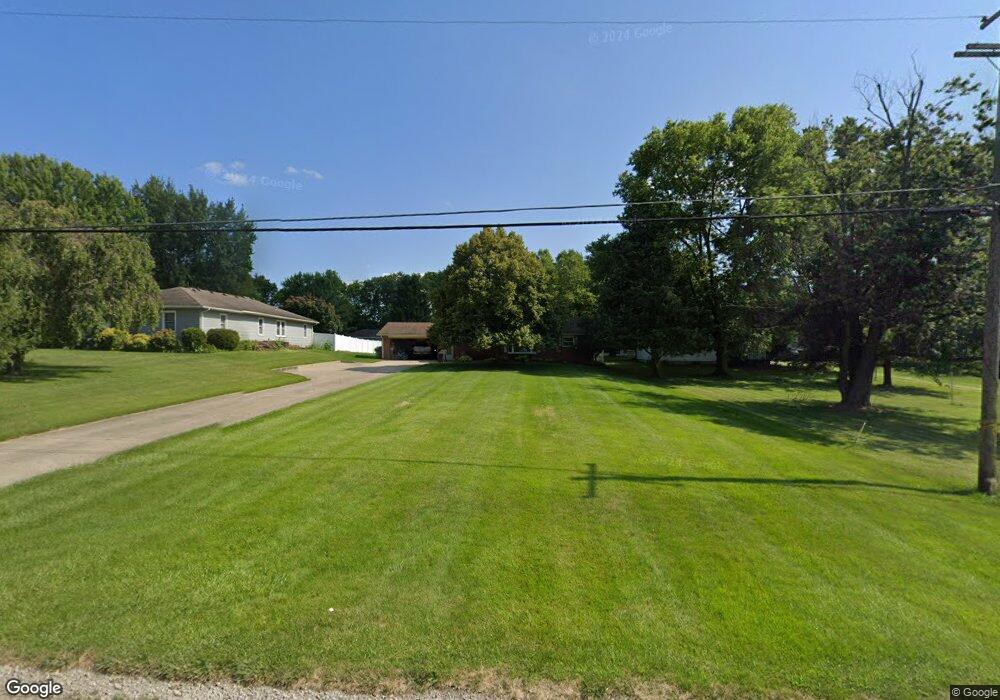
This home is located at 3814 W State Route 185, Piqua, OH 45356 and is currently estimated at $228,713, approximately $198 per square foot. 3814 W State Route 185 is a home located in Miami County with nearby schools including Washington Primary School, Piqua Junior High School, and Piqua High School.
Ownership History
Date
Name
Owned For
Owner Type
Purchase Details
Closed on
Jan 30, 2013
Sold by
Ottenwess Ronald and Ottenwess June Lea
Bought by
Midfirst Bank
Current Estimated Value
Purchase Details
Closed on
Jan 24, 2013
Sold by
Midfirst Bank
Bought by
Secretary Of Housing & Urban Development
Purchase Details
Closed on
Nov 28, 2012
Sold by
Ottenwess Ronald and Ottenwess June L
Bought by
Midfirst Bank
Purchase Details
Closed on
May 24, 2006
Sold by
Melton Joseph E and Melton Irene J
Bought by
Ottenwess Ronald and Ottenwess June Lea
Purchase Details
Closed on
Jun 22, 2005
Sold by
Selle John A and Selle Martha J
Bought by
Melton Joseph E and Melton Irene J
Purchase Details
Closed on
Oct 27, 1995
Sold by
Paul E Dunlavy
Bought by
Selle John A and Selle Martha J
Home Financials for this Owner
Home Financials are based on the most recent Mortgage that was taken out on this home.
Original Mortgage
$97,200
Interest Rate
7.25%
Mortgage Type
New Conventional
Create a Home Valuation Report for This Property
The Home Valuation Report is an in-depth analysis detailing your home's value as well as a comparison with similar homes in the area
Home Values in the Area
Average Home Value in this Area
Purchase History
| Date | Buyer | Sale Price | Title Company |
|---|---|---|---|
| Midfirst Bank | $169,379 | None Available | |
| Secretary Of Housing & Urban Development | -- | None Available | |
| Midfirst Bank | $169,379 | None Available | |
| Ottenwess Ronald | $100,000 | -- | |
| Melton Joseph E | $130,000 | -- | |
| Selle John A | $121,500 | -- |
Source: Public Records
Mortgage History
| Date | Status | Borrower | Loan Amount |
|---|---|---|---|
| Previous Owner | Selle John A | $97,200 | |
| Closed | Melton Joseph E | $0 |
Source: Public Records
Tax History Compared to Growth
Tax History
| Year | Tax Paid | Tax Assessment Tax Assessment Total Assessment is a certain percentage of the fair market value that is determined by local assessors to be the total taxable value of land and additions on the property. | Land | Improvement |
|---|---|---|---|---|
| 2024 | $2,419 | $53,210 | $9,070 | $44,140 |
| 2023 | $2,419 | $53,210 | $9,070 | $44,140 |
| 2022 | $2,248 | $53,210 | $9,070 | $44,140 |
| 2021 | $2,059 | $44,350 | $7,560 | $36,790 |
| 2020 | $2,018 | $44,350 | $7,560 | $36,790 |
| 2019 | $2,029 | $44,350 | $7,560 | $36,790 |
| 2018 | $1,939 | $40,470 | $7,530 | $32,940 |
| 2017 | $1,962 | $40,470 | $7,530 | $32,940 |
| 2016 | $1,938 | $40,470 | $7,530 | $32,940 |
| 2015 | $1,794 | $37,460 | $6,970 | $30,490 |
| 2014 | $1,794 | $37,460 | $6,970 | $30,490 |
| 2013 | $1,852 | $37,460 | $6,970 | $30,490 |
Source: Public Records
Map
Nearby Homes
- 8490 Bennett Dr
- 1337 Stratford Dr
- 3 Lake Ridge Dr
- 1616 Echo Lake Dr
- 513 Spotted Doe Trail
- 1821 Wilshire Dr
- 1119 Anderson St
- 1708 Dubois Dr
- 4510 W State Route 185
- 1271 Park Ave
- 4528 W State Route 185
- 1207 Maplewood Dr
- 817 Washington Ave
- 1516 Madison Ave
- 1115 Madison Ave
- 209 Drexel Ave
- 1012 Maple St
- 1026 Lincoln St
- 3814 Ohio 185
- 3802 W State Route 185
- 3820 W State Route 185
- 3836 Ohio 185
- 3836 W State Route 185
- 3780 W State Route 185
- 3803 W State Route 185
- 3848 W State Route 185
- 3768 W State Route 185
- 3760 W State Route 185
- 3781 W State Route 185
- 20 Eagles Way
- 15 Eagles Way
- 3769 W State Route 185
- 15 Falcons Nest Ct
- 3748 W State Route 185
- 3876 W State Route 185
- 10 Falcons Nest Ct
- 3755 W State Route 185
- 14 Eagles Way