3815 Cortlandt St Houston, TX 77018
Independence Heights NeighborhoodEstimated Value: $151,000 - $998,000
--
Bed
1
Bath
--
Sq Ft
2,614
Sq Ft Lot
About This Home
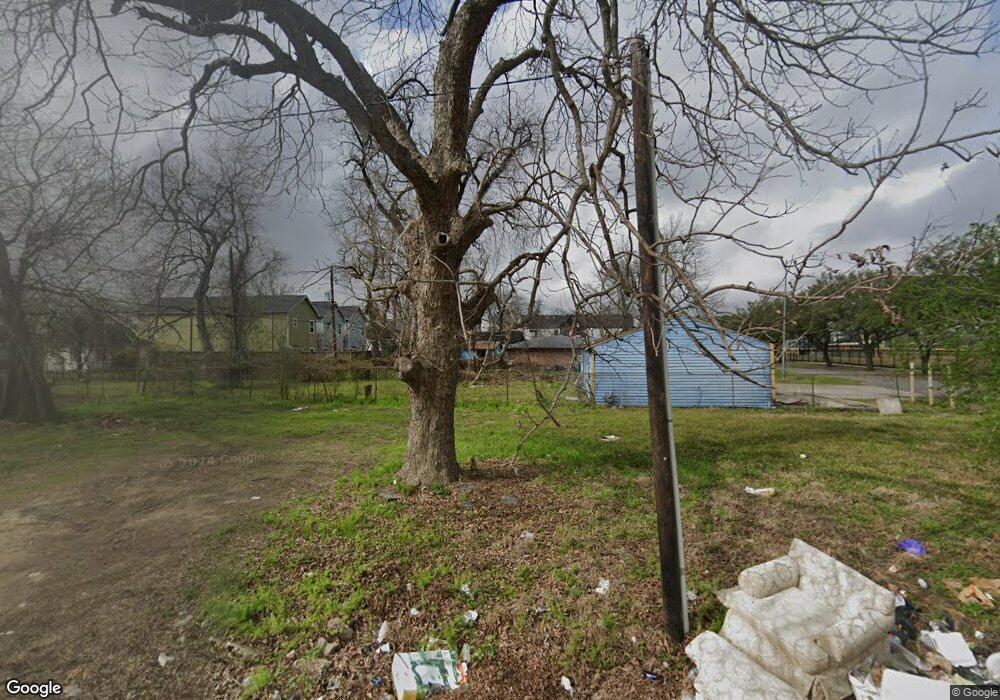
This home is located at 3815 Cortlandt St, Houston, TX 77018 and is currently estimated at $500,333. 3815 Cortlandt St is a home located in Harris County with nearby schools including Burrus Elementary School, Williams Middle, and Booker T Washington Sr High.
Ownership History
Date
Name
Owned For
Owner Type
Purchase Details
Closed on
Mar 1, 2017
Sold by
Ht Investments
Bought by
Toghani Hossein
Current Estimated Value
Purchase Details
Closed on
Feb 22, 2017
Sold by
Salha Ahmed G
Bought by
Toghani Hossein
Purchase Details
Closed on
Sep 11, 2009
Sold by
Giral Leonela
Bought by
Salha Ahmed
Purchase Details
Closed on
Oct 1, 2008
Sold by
Salha Ali Gevara
Bought by
Giral Leonela
Purchase Details
Closed on
Jun 1, 2008
Sold by
Nassiriavanaki Mohammad R
Bought by
Salha Ali Gevara
Purchase Details
Closed on
Oct 24, 2007
Sold by
Williams Sloan E and Williams Estelle
Bought by
Nassiriavanaki Mohammad R
Create a Home Valuation Report for This Property
The Home Valuation Report is an in-depth analysis detailing your home's value as well as a comparison with similar homes in the area
Home Values in the Area
Average Home Value in this Area
Purchase History
| Date | Buyer | Sale Price | Title Company |
|---|---|---|---|
| Toghani Hossein | -- | None Available | |
| Toghani Hossein | -- | None Available | |
| Salha Ahmed | -- | None Available | |
| Giral Leonela | -- | None Available | |
| Salha Ali Gevara | -- | None Available | |
| Nassiriavanaki Mohammad R | $7,500 | None Available |
Source: Public Records
Tax History Compared to Growth
Tax History
| Year | Tax Paid | Tax Assessment Tax Assessment Total Assessment is a certain percentage of the fair market value that is determined by local assessors to be the total taxable value of land and additions on the property. | Land | Improvement |
|---|---|---|---|---|
| 2025 | $2,343 | $112,000 | $112,000 | -- |
| 2024 | $2,343 | $112,000 | $112,000 | -- |
| 2023 | $2,267 | $112,500 | $112,500 | $0 |
| 2022 | $3,171 | $69,900 | $69,900 | $0 |
| 2021 | $2,797 | $120,000 | $120,000 | $0 |
| 2020 | $1,584 | $120,000 | $120,000 | $0 |
| 2019 | $1,822 | $105,000 | $105,000 | $0 |
| 2018 | $2,274 | $90,000 | $90,000 | $0 |
| 2017 | $876 | $36,000 | $36,000 | $0 |
| 2016 | $607 | $24,000 | $24,000 | $0 |
| 2015 | $360 | $24,000 | $24,000 | $0 |
| 2014 | $360 | $14,000 | $14,000 | $0 |
Source: Public Records
Map
Nearby Homes