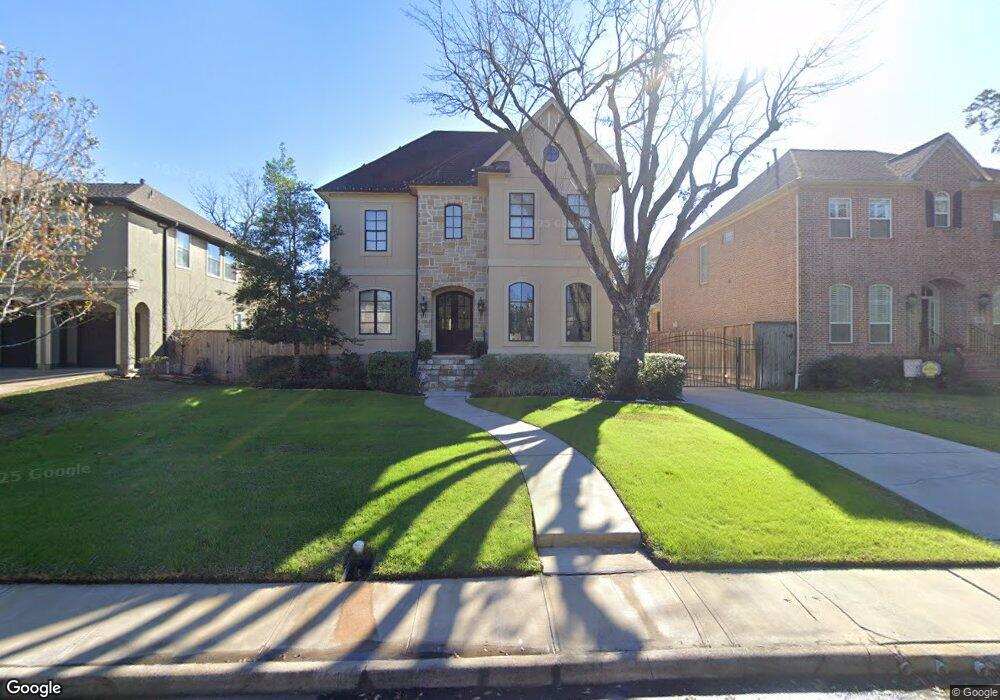
3815 Durness Way Houston, TX 77025
Braeswood Place NeighborhoodEstimated Value: $1,509,317 - $1,721,000
4
Beds
5
Baths
4,177
Sq Ft
$379/Sq Ft
Est. Value
About This Home
This home is located at 3815 Durness Way, Houston, TX 77025 and is currently estimated at $1,584,579, approximately $379 per square foot. 3815 Durness Way is a home located in Harris County with nearby schools including Twain Elementary School, Pershing Middle School, and Lamar High School.
Ownership History
Date
Name
Owned For
Owner Type
Purchase Details
Closed on
Mar 4, 2020
Sold by
Fischer Lauren W and Fischer Jason A
Bought by
Nemeth Ira Robert and Nemeth Lauren Renee
Current Estimated Value
Home Financials for this Owner
Home Financials are based on the most recent Mortgage that was taken out on this home.
Original Mortgage
$510,400
Outstanding Balance
$451,170
Interest Rate
3.4%
Mortgage Type
Purchase Money Mortgage
Estimated Equity
$1,133,409
Purchase Details
Closed on
Feb 28, 2014
Sold by
Hope George J and Hope Elvira
Bought by
Fischer Lauren W
Home Financials for this Owner
Home Financials are based on the most recent Mortgage that was taken out on this home.
Original Mortgage
$841,190
Interest Rate
4.47%
Mortgage Type
New Conventional
Purchase Details
Closed on
Mar 21, 2003
Sold by
Cantu Fermin and Cantu Mary F
Bought by
Hope George J
Home Financials for this Owner
Home Financials are based on the most recent Mortgage that was taken out on this home.
Original Mortgage
$188,000
Interest Rate
5.83%
Create a Home Valuation Report for This Property
The Home Valuation Report is an in-depth analysis detailing your home's value as well as a comparison with similar homes in the area
Home Values in the Area
Average Home Value in this Area
Purchase History
| Date | Buyer | Sale Price | Title Company |
|---|---|---|---|
| Nemeth Ira Robert | -- | Stratos Title | |
| Fischer Lauren W | -- | Old Republic Natl Title Ins | |
| Hope George J | -- | Fidelity National Title |
Source: Public Records
Mortgage History
| Date | Status | Borrower | Loan Amount |
|---|---|---|---|
| Open | Nemeth Ira Robert | $510,400 | |
| Previous Owner | Fischer Lauren W | $841,190 | |
| Previous Owner | Hope George J | $188,000 |
Source: Public Records
Tax History Compared to Growth
Tax History
| Year | Tax Paid | Tax Assessment Tax Assessment Total Assessment is a certain percentage of the fair market value that is determined by local assessors to be the total taxable value of land and additions on the property. | Land | Improvement |
|---|---|---|---|---|
| 2025 | $22,548 | $1,504,277 | $507,813 | $996,464 |
| 2024 | $22,548 | $1,396,484 | $468,750 | $927,734 |
| 2023 | $22,548 | $1,322,332 | $468,750 | $853,582 |
| 2022 | $25,456 | $1,216,122 | $414,063 | $802,059 |
| 2021 | $24,495 | $1,050,980 | $414,063 | $636,917 |
| 2020 | $28,311 | $1,169,100 | $390,625 | $778,475 |
| 2019 | $27,016 | $1,067,635 | $390,625 | $677,010 |
| 2018 | $27,683 | $1,094,000 | $406,250 | $687,750 |
| 2017 | $30,386 | $1,201,700 | $546,875 | $654,825 |
| 2016 | $30,386 | $1,201,700 | $546,875 | $654,825 |
| 2015 | $19,206 | $1,201,700 | $546,875 | $654,825 |
| 2014 | $19,206 | $1,011,300 | $453,125 | $558,175 |
Source: Public Records
Map
Nearby Homes
- 3822 Tartan Ln
- 3835 Tartan Ln
- 3839 Tartan Ln
- 8431 Braes Blvd
- 3809 N Braeswood Blvd Unit 14
- 3809 N Braeswood Blvd Unit 24
- 3735 Tartan Ln
- 3722 N Braeswood Blvd
- 3731 Grennoch Ln
- 3835 Merrick St
- 3851 Merrick St
- 3750 Merrick St
- 3714 Grennoch Ln
- 3751 Aberdeen Way
- 4047 Falkirk Ln
- 4035 Merrick St
- 8614 Linkpass Ln
- 8707 Linkmeadow Ln
- 3614 N Braeswood Blvd
- 8422 Academy St
- 3819 Durness Way
- 3813 Durness Way
- 3823 Durness Way
- 3811 Durness Way
- 3818 Tartan Ln
- 3826 Tartan Ln
- 3814 Tartan Ln
- 3827 Durness Way
- 3814 Durness Way
- 3832 Tartan Ln
- 3807 Durness Way
- 3818 Durness Way
- 3812 Durness Way
- 3822 Durness Way
- 3810 Durness Way
- 3810 Tartan Ln
- 3831 Durness Way
- 3838 Tartan Ln
- 3826 Durness Way
- 3806 Durness Way