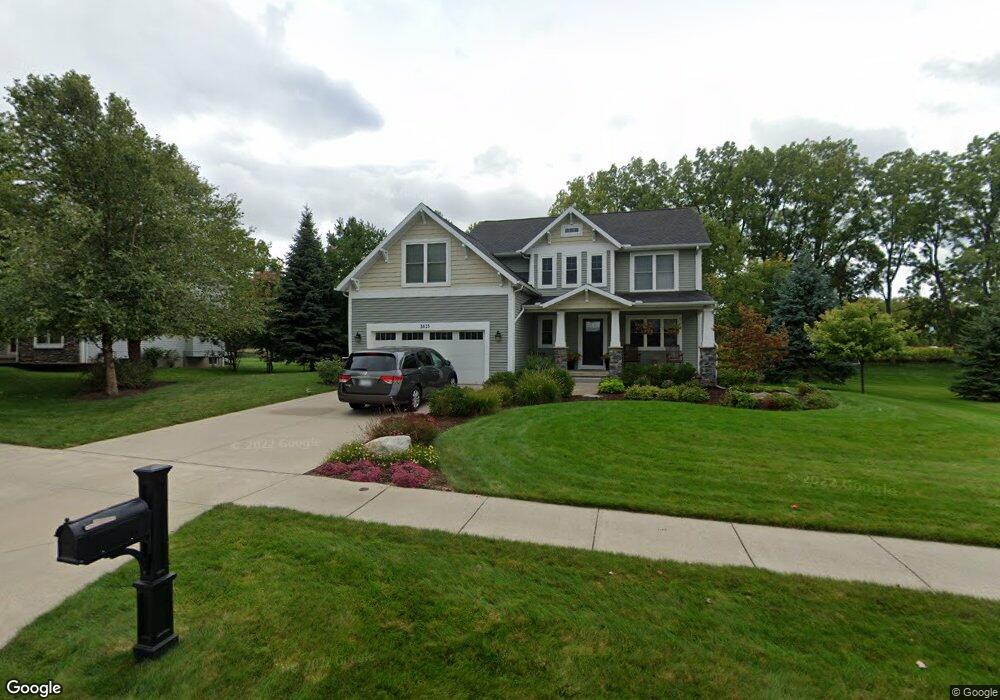
3815 Glade Way Lansing, MI 48906
Estimated Value: $394,000 - $446,000
3
Beds
3
Baths
2,198
Sq Ft
$186/Sq Ft
Est. Value
About This Home
This home is located at 3815 Glade Way, Lansing, MI 48906 and is currently estimated at $409,685, approximately $186 per square foot. 3815 Glade Way is a home located in Clinton County with nearby schools including Schavey Road Elementary School, Herbison Woods Elementary School, and Scott Elementary School.
Ownership History
Date
Name
Owned For
Owner Type
Purchase Details
Closed on
Feb 26, 2019
Sold by
Kuebler Michael R and Kuebler Sarah M
Bought by
Kuebler Michael R and Kuebler Sarah M
Current Estimated Value
Purchase Details
Closed on
Jan 30, 2013
Sold by
Kuebler Michael
Bought by
Kuebler Michael and Kuebler Sarah
Purchase Details
Closed on
May 22, 2007
Sold by
Kuebler Michael and Kuebler Sarah
Bought by
Kuebler Michael and Kuebler Sarah
Purchase Details
Closed on
Jul 29, 2005
Sold by
First Dewitt Ii Llc
Bought by
Kuebler Michael R and Kuebler Sarah M
Home Financials for this Owner
Home Financials are based on the most recent Mortgage that was taken out on this home.
Original Mortgage
$235,980
Interest Rate
5.66%
Mortgage Type
Construction
Create a Home Valuation Report for This Property
The Home Valuation Report is an in-depth analysis detailing your home's value as well as a comparison with similar homes in the area
Home Values in the Area
Average Home Value in this Area
Purchase History
| Date | Buyer | Sale Price | Title Company |
|---|---|---|---|
| Kuebler Michael R | -- | None Available | |
| Kuebler Michael R | -- | None Available | |
| Kuebler Michael | -- | Fidelity Natl Title Co Llc | |
| Kuebler Michael | -- | None Available | |
| Kuebler Michael R | $45,000 | -- |
Source: Public Records
Mortgage History
| Date | Status | Borrower | Loan Amount |
|---|---|---|---|
| Closed | Kuebler Michael R | $235,980 |
Source: Public Records
Tax History Compared to Growth
Tax History
| Year | Tax Paid | Tax Assessment Tax Assessment Total Assessment is a certain percentage of the fair market value that is determined by local assessors to be the total taxable value of land and additions on the property. | Land | Improvement |
|---|---|---|---|---|
| 2025 | -- | $191,400 | $29,500 | $161,900 |
| 2024 | $2,941 | $177,800 | $27,100 | $150,700 |
| 2023 | $3,303 | $162,300 | $0 | $0 |
| 2022 | $5,109 | $150,100 | $24,200 | $125,900 |
| 2021 | $4,959 | $140,300 | $22,900 | $117,400 |
| 2020 | $4,837 | $133,900 | $22,000 | $111,900 |
| 2019 | $4,644 | $127,900 | $17,300 | $110,600 |
| 2018 | $4,431 | $125,200 | $16,400 | $108,800 |
| 2017 | $4,371 | $123,100 | $16,300 | $106,800 |
| 2016 | $4,388 | $117,700 | $16,300 | $101,400 |
| 2015 | $4,320 | $114,000 | $0 | $0 |
| 2011 | -- | $110,400 | $0 | $0 |
Source: Public Records
Map
Nearby Homes
- 15277 Sherwood Ln
- 15080 Loxley Ln Unit 21
- 15347 Sherwood Ln
- 15317 Sherwood Ln
- 15292 Sherwood Ln
- 15312 Sherwood Ln
- 15332 Sherwood Ln
- 15240 Nottingham Fields Pkwy
- 15260 Nottingham Fields Pkwy
- 15250 Nottingham Fields Pkwy
- 15895 Turnberry St
- V/L W State Rd
- V/L N Grove
- Integrity 1880 Plan at Shadybrook - Integrity
- Integrity 1610 Plan at Shadybrook - Integrity
- Integrity 1605 Plan at Shadybrook - Integrity
- Elements 1870 Plan at Shadybrook
- Elements 2070 Plan at Shadybrook
- Elements 2700 Plan at Shadybrook
- Integrity 1830 Plan at Shadybrook - Integrity