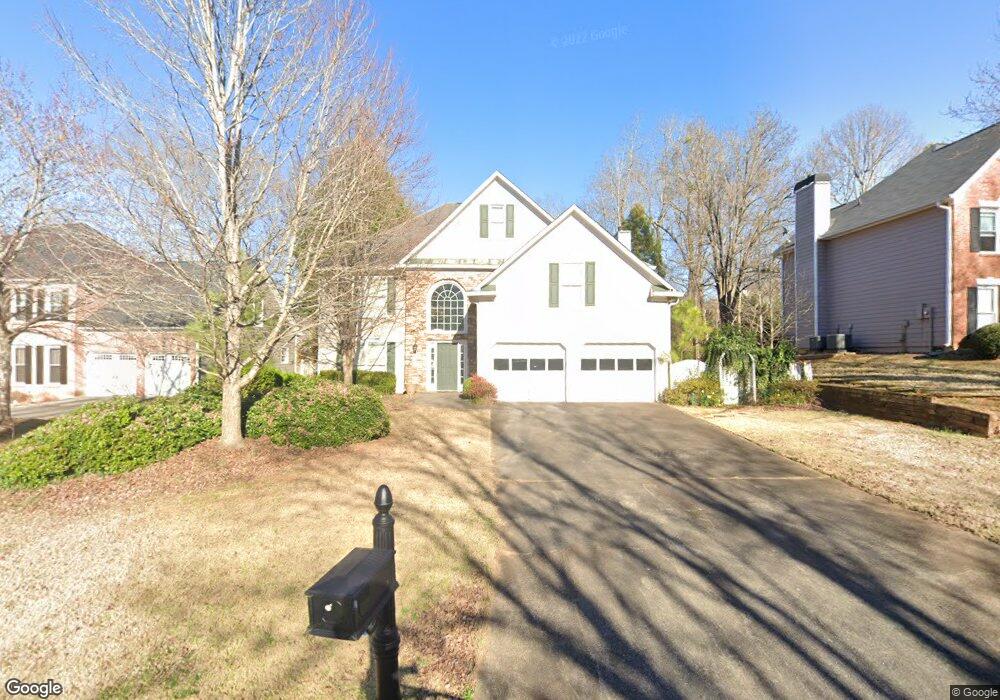
3815 Peachbluff Ct Unit 2 Duluth, GA 30097
Estimated Value: $543,000 - $621,000
4
Beds
3
Baths
2,780
Sq Ft
$206/Sq Ft
Est. Value
About This Home
This home is located at 3815 Peachbluff Ct Unit 2, Duluth, GA 30097 and is currently estimated at $573,712, approximately $206 per square foot. 3815 Peachbluff Ct Unit 2 is a home located in Gwinnett County with nearby schools including Burnette Elementary School, Hull Middle School, and Peachtree Ridge High School.
Ownership History
Date
Name
Owned For
Owner Type
Purchase Details
Closed on
Jun 16, 2014
Sold by
Barkowski Veva R
Bought by
Appel Steven
Current Estimated Value
Home Financials for this Owner
Home Financials are based on the most recent Mortgage that was taken out on this home.
Original Mortgage
$189,000
Outstanding Balance
$139,566
Interest Rate
3.6%
Mortgage Type
New Conventional
Estimated Equity
$434,146
Purchase Details
Closed on
Jul 11, 2011
Sold by
Rodriguez Ruben and Rodriguez Diana B
Bought by
Walter Robert C and Walter Paula A
Purchase Details
Closed on
Aug 31, 2010
Sold by
Freeman William F and Freeman Kristen B
Bought by
Appel Steven and Barkowski Veva
Home Financials for this Owner
Home Financials are based on the most recent Mortgage that was taken out on this home.
Original Mortgage
$200,000
Interest Rate
4.59%
Mortgage Type
New Conventional
Purchase Details
Closed on
May 5, 1994
Sold by
Traton Corp Gwinnett
Bought by
Freeman William F Kris
Create a Home Valuation Report for This Property
The Home Valuation Report is an in-depth analysis detailing your home's value as well as a comparison with similar homes in the area
Home Values in the Area
Average Home Value in this Area
Purchase History
| Date | Buyer | Sale Price | Title Company |
|---|---|---|---|
| Appel Steven | -- | -- | |
| Appel Steven | -- | -- | |
| Walter Robert C | $176,000 | -- | |
| Walter Robert C | $176,000 | -- | |
| Appel Steven | $250,000 | -- | |
| Appel Steven | $250,000 | -- | |
| Freeman William F Kris | $160,200 | -- | |
| Freeman William F Kris | $160,200 | -- |
Source: Public Records
Mortgage History
| Date | Status | Borrower | Loan Amount |
|---|---|---|---|
| Open | Appel Steven | $189,000 | |
| Previous Owner | Appel Steven | $200,000 |
Source: Public Records
Tax History Compared to Growth
Tax History
| Year | Tax Paid | Tax Assessment Tax Assessment Total Assessment is a certain percentage of the fair market value that is determined by local assessors to be the total taxable value of land and additions on the property. | Land | Improvement |
|---|---|---|---|---|
| 2025 | $6,631 | $206,600 | $48,240 | $158,360 |
| 2024 | $6,568 | $196,440 | $40,000 | $156,440 |
| 2023 | $6,568 | $192,120 | $40,000 | $152,120 |
| 2022 | $5,968 | $158,280 | $32,000 | $126,280 |
| 2021 | $4,889 | $125,920 | $26,000 | $99,920 |
| 2020 | $4,917 | $125,920 | $26,000 | $99,920 |
| 2019 | $4,735 | $125,920 | $26,000 | $99,920 |
| 2018 | $4,430 | $117,000 | $22,400 | $94,600 |
| 2016 | $4,036 | $105,320 | $20,000 | $85,320 |
| 2015 | $3,691 | $94,320 | $15,600 | $78,720 |
| 2014 | $3,711 | $94,320 | $15,600 | $78,720 |
Source: Public Records
Map
Nearby Homes
- 3760 Peachbluff Ct Unit 2
- 2051 Glenview Park Cir
- 2005 Hailston Dr
- 2207 Parkside Glen View
- 1758 Glenview Park Cir
- 2008 Hailston Dr
- 3899 Glenview Club Ln
- 1850 Noblin Ridge Way
- 3920 Glenview Club Ln
- 1755 Noblin Summit Dr
- 2070 Hailston Dr
- 1894 Point River Dr
- 1929 Point River Dr
- 4290 Canterbury Walk Dr
- 2052 Tallapoosa Dr
- 2107 Hailston Dr
- 3815 Peachbluff Ct
- 3805 Peachbluff Ct
- 3825 Peachbluff Ct
- 3814 Grayridge Dr
- 3824 Grayridge Dr Unit 1
- 1915 Peachbluff Dr
- 1925 Peachbluff Dr
- 3820 Peachbluff Ct
- 3810 Peachbluff Ct
- 3835 Peachbluff Ct
- 1905 Peachbluff Dr Unit 1
- 3834 Grayridge Dr Unit 1
- 1935 Peachbluff Dr
- 3830 Peachbluff Ct Unit 2
- 1945 Peachbluff Dr
- 3844 Grayridge Dr
- 3819 Grayridge Dr Unit 1
- 3775 Peachbluff Ct
- 3817 Lance Bluff Ct Unit 2
- 1910 Peachbluff Dr