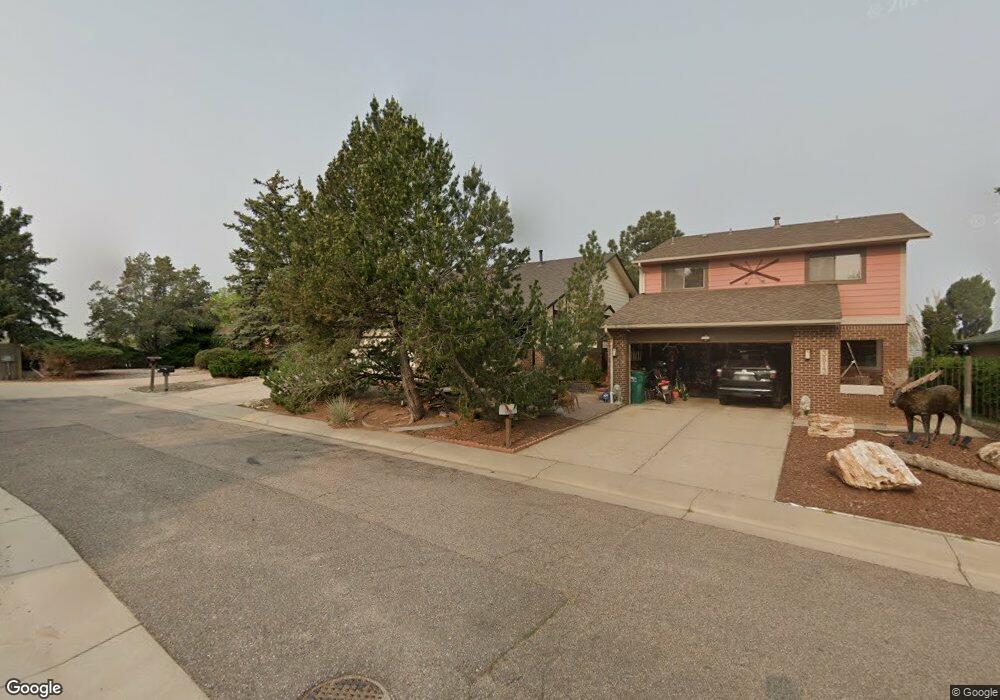
3815 S Atchison Way Aurora, CO 80014
Meadow Hills NeighborhoodEstimated Value: $441,000 - $496,000
3
Beds
3
Baths
1,049
Sq Ft
$442/Sq Ft
Est. Value
About This Home
This home is located at 3815 S Atchison Way, Aurora, CO 80014 and is currently estimated at $463,355, approximately $441 per square foot. 3815 S Atchison Way is a home located in Arapahoe County with nearby schools including Polton Community Elementary School, Prairie Middle School, and Overland High School.
Ownership History
Date
Name
Owned For
Owner Type
Purchase Details
Closed on
Aug 10, 1989
Sold by
Secretary Of Housing & Urban Dev
Bought by
Bowman Allen D
Current Estimated Value
Purchase Details
Closed on
Dec 13, 1988
Sold by
Citicorp Mortgage Inc
Bought by
Secretary Of Housing & Urban Dev
Purchase Details
Closed on
Nov 14, 1988
Sold by
Morvay Rastislav M and Morvay Christine P
Bought by
Citicorp Mortgage Inc
Purchase Details
Closed on
May 26, 1987
Sold by
Aurora Security Pacific Industrial Bank
Bought by
Morvay Rastislav M and Morvay Christine P
Purchase Details
Closed on
Jan 8, 1987
Sold by
Conversion Arapco
Bought by
Aurora Security Pacific Industrial Bank
Purchase Details
Closed on
Jul 1, 1981
Sold by
Conversion Arapco
Bought by
Conversion Arapco
Purchase Details
Closed on
Jul 4, 1776
Bought by
Conversion Arapco
Create a Home Valuation Report for This Property
The Home Valuation Report is an in-depth analysis detailing your home's value as well as a comparison with similar homes in the area
Home Values in the Area
Average Home Value in this Area
Purchase History
| Date | Buyer | Sale Price | Title Company |
|---|---|---|---|
| Bowman Allen D | -- | -- | |
| Secretary Of Housing & Urban Dev | -- | -- | |
| Citicorp Mortgage Inc | -- | -- | |
| Morvay Rastislav M | -- | -- | |
| Aurora Security Pacific Industrial Bank | -- | -- | |
| Conversion Arapco | -- | -- | |
| Conversion Arapco | -- | -- |
Source: Public Records
Tax History Compared to Growth
Tax History
| Year | Tax Paid | Tax Assessment Tax Assessment Total Assessment is a certain percentage of the fair market value that is determined by local assessors to be the total taxable value of land and additions on the property. | Land | Improvement |
|---|---|---|---|---|
| 2024 | $2,531 | $28,094 | -- | -- |
| 2023 | $2,531 | $28,094 | $0 | $0 |
| 2022 | $2,284 | $23,498 | $0 | $0 |
| 2021 | $2,311 | $23,498 | $0 | $0 |
| 2020 | $2,277 | $23,574 | $0 | $0 |
| 2019 | $2,228 | $23,574 | $0 | $0 |
| 2018 | $2,037 | $19,526 | $0 | $0 |
| 2017 | $2,000 | $19,526 | $0 | $0 |
| 2016 | $1,930 | $17,130 | $0 | $0 |
| 2015 | $1,877 | $17,130 | $0 | $0 |
| 2014 | -- | $10,794 | $0 | $0 |
| 2013 | -- | $13,190 | $0 | $0 |
Source: Public Records
Map
Nearby Homes
- 3825 S Atchison Way
- 3807 S Atchison Way
- 4074 S Atchison Way Unit 101
- 4046 S Abilene Cir Unit B
- 4070 S Atchison Way Unit 101
- 4052 S Abilene Cir Unit C
- 4068 S Atchison Way Unit 202
- 4068 S Atchison Way Unit 101
- 4062 S Atchison Way Unit 101
- 13950 E Oxford Place Unit A210
- 13950 E Oxford Place Unit B206
- 13950 E Oxford Place Unit B204
- 4066 S Atchison Way Unit 102
- 4066 S Atchison Way Unit 101
- 4066 S Atchison Way Unit 301
- 4034 S Atchison Way
- 13792 E Lehigh Ave Unit F
- 13792 E Lehigh Ave Unit E
- 13762 E Lehigh Ave Unit B
- 4076 S Carson St Unit H
- 3813 S Atchison Way
- 3817 S Atchison Way
- 3811 S Atchison Way
- 3819 S Atchison Way
- 3809 S Atchison Way
- 3829 S Atchison Way
- 3825 R S Atchison Way
- 3823 S Atchison Way
- 3827 S Atchison Way
- 3805 S Atchison Way
- 3821 S Atchison Way
- 3831 S Atchison Way
- 3801 S Atchison Way
- 3859 S Atchison Way
- 3803 S Atchison Way
- 3833 S Atchison Way
- 3863 S Atchison Way
- 3835 S Atchison Way
- 3853 S Atchison Way
- 3855 S Atchison Way