Estimated Value: $355,000 - $395,469
4
Beds
2
Baths
2,114
Sq Ft
$181/Sq Ft
Est. Value
About This Home
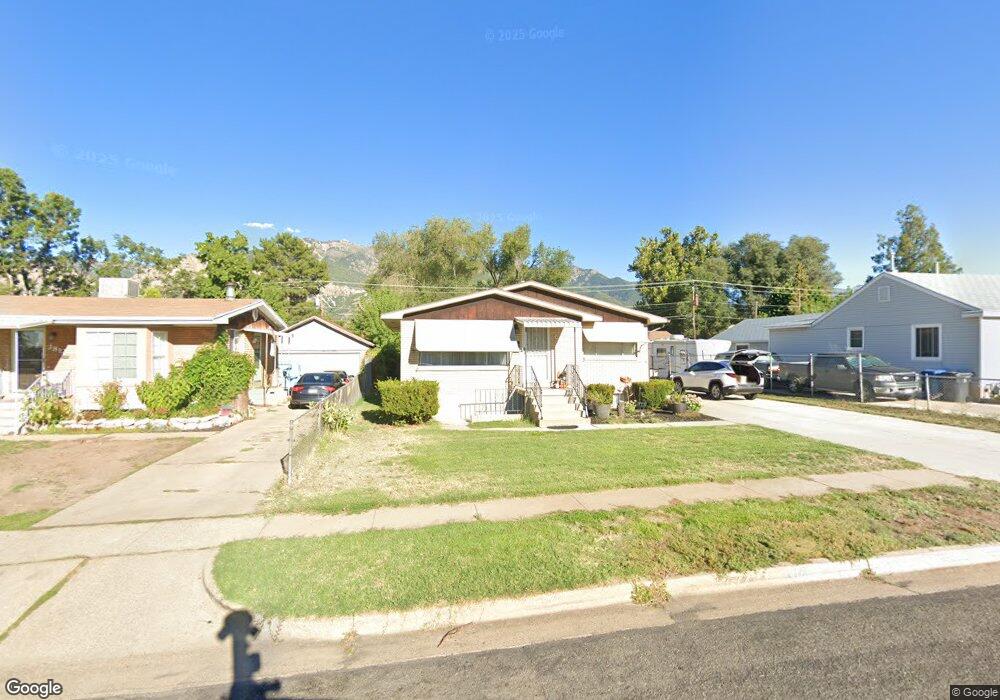
This home is located at 3816 Ogden Ave, Ogden, UT 84403 and is currently estimated at $381,867, approximately $180 per square foot. 3816 Ogden Ave is a home located in Weber County with nearby schools including Burch Creek School, South Ogden Junior High School, and Bonneville High School.
Ownership History
Date
Name
Owned For
Owner Type
Purchase Details
Closed on
Sep 30, 2019
Sold by
Maxfield Charles Creigh and Maxfield Patricia
Bought by
Maxfield Charles C and Maxfield Patricia
Current Estimated Value
Home Financials for this Owner
Home Financials are based on the most recent Mortgage that was taken out on this home.
Original Mortgage
$158,900
Outstanding Balance
$105,935
Interest Rate
3.5%
Mortgage Type
New Conventional
Estimated Equity
$275,932
Purchase Details
Closed on
Aug 21, 2008
Sold by
Maxfield Charles Creigh and Maxfield Patricia
Bought by
Maxfield Charles Creigh and Maxfield Patricia
Home Financials for this Owner
Home Financials are based on the most recent Mortgage that was taken out on this home.
Original Mortgage
$15,000
Interest Rate
6.37%
Mortgage Type
New Conventional
Purchase Details
Closed on
Sep 29, 2004
Sold by
Flint Irene S
Bought by
Maxfield Charles Creigh and Hernandez Patricia
Home Financials for this Owner
Home Financials are based on the most recent Mortgage that was taken out on this home.
Original Mortgage
$115,586
Interest Rate
5.76%
Mortgage Type
FHA
Purchase Details
Closed on
Feb 17, 1999
Sold by
Flint Irene S
Bought by
Flint Irene S
Create a Home Valuation Report for This Property
The Home Valuation Report is an in-depth analysis detailing your home's value as well as a comparison with similar homes in the area
Home Values in the Area
Average Home Value in this Area
Purchase History
| Date | Buyer | Sale Price | Title Company |
|---|---|---|---|
| Maxfield Charles C | -- | First Amer Fashion Pointe | |
| Maxfield Charles Creigh | -- | Accommodation | |
| Maxfield Charles Creigh | -- | First American Title | |
| Flint Irene S | -- | -- |
Source: Public Records
Mortgage History
| Date | Status | Borrower | Loan Amount |
|---|---|---|---|
| Open | Maxfield Charles C | $158,900 | |
| Closed | Maxfield Charles Creigh | $15,000 | |
| Closed | Maxfield Charles Creigh | $115,586 |
Source: Public Records
Tax History
| Year | Tax Paid | Tax Assessment Tax Assessment Total Assessment is a certain percentage of the fair market value that is determined by local assessors to be the total taxable value of land and additions on the property. | Land | Improvement |
|---|---|---|---|---|
| 2025 | $2,718 | $206,930 | $60,829 | $146,101 |
| 2024 | $2,545 | $196,898 | $60,743 | $136,155 |
| 2023 | $2,443 | $189,750 | $59,487 | $130,263 |
| 2022 | $2,410 | $193,600 | $48,108 | $145,492 |
| 2021 | $1,953 | $259,000 | $52,057 | $206,943 |
| 2020 | $1,854 | $229,000 | $41,756 | $187,244 |
| 2019 | $1,723 | $201,000 | $33,665 | $167,335 |
| 2018 | $1,677 | $186,000 | $33,665 | $152,335 |
| 2017 | $1,461 | $152,000 | $31,663 | $120,337 |
| 2016 | $1,408 | $81,787 | $17,109 | $64,678 |
| 2015 | $1,430 | $81,788 | $17,109 | $64,679 |
| 2014 | $1,165 | $63,092 | $17,109 | $45,983 |
Source: Public Records
Map
Nearby Homes
- 3858 Ogden Ave
- 428 37th St
- 3683 Adams Ave
- 3760 Jefferson Ave
- 3675 Porter Ave
- 4014 Porter Ave
- 325 E Chimes View Cir
- 3874 Orchard Ave
- 26 Sylvia Dr
- 3874 Childs Ave
- 3624 Porter Ave
- 302 40th St
- 3596 Adams Ave
- 668 37th St
- 3567 Adams Ave
- 3555 Adams Ave
- 225 Chimes View Cir
- 239 E Burch Creek Place
- 3538 Adams Ave
- 4067 Hillcrest Cir
- 3850 Ogden Ave
- 3812 Ogden Ave
- 3810 Ogden Ave
- 3860 Ogden Ave
- 3835 Adams Ave
- 3841 Adams Ave
- 3806 Ogden Ave
- 3829 Adams Ave
- 3857 Adams Ave
- 3825 Adams Ave
- 3811 Ogden Ave
- 3809 Ogden Ave
- 3813 Ogden Ave
- 3813 Ogden Ave Unit Suite C
- 3864 Ogden Ave
- 3859 Adams Ave
- 3800 Ogden Ave
- 3807 Ogden Ave
- 3815 Adams Ave
- 3819 Ogden Ave
Your Personal Tour Guide
Ask me questions while you tour the home.