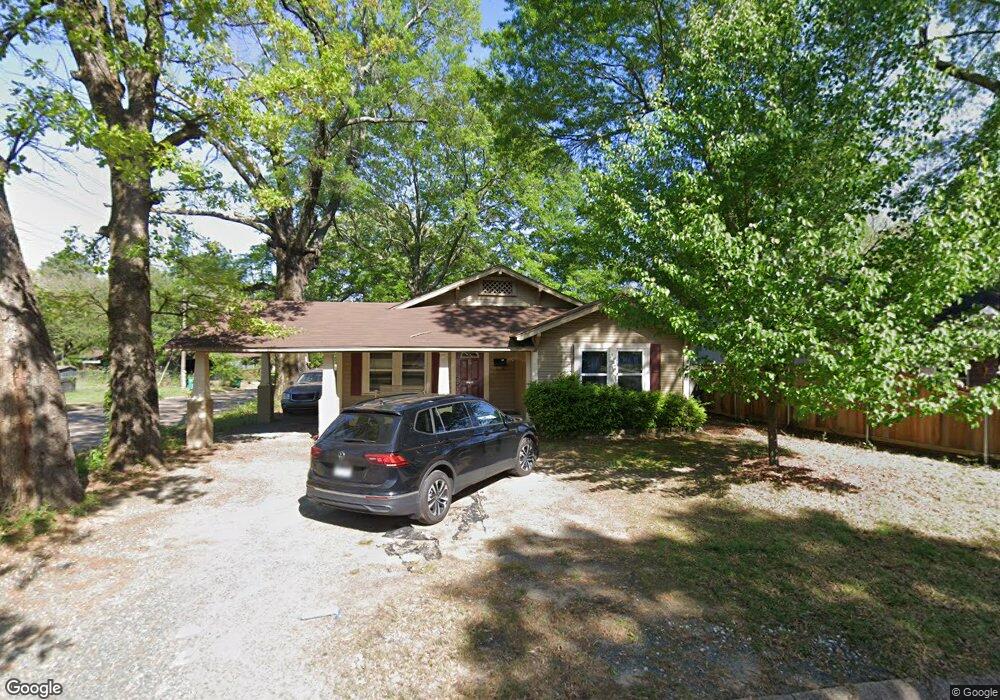
3816 Olive St Texarkana, TX 75503
Estimated Value: $119,000 - $151,000
--
Bed
--
Bath
1,440
Sq Ft
$92/Sq Ft
Est. Value
About This Home
This home is located at 3816 Olive St, Texarkana, TX 75503 and is currently estimated at $133,200, approximately $92 per square foot. 3816 Olive St is a home located in Bowie County with nearby schools including Spring Lake Park Elementary School, Texas Middle School, and Texas High School.
Ownership History
Date
Name
Owned For
Owner Type
Purchase Details
Closed on
Nov 30, 2006
Sold by
Thomas Sherri K Warren and Thomas Jimmy
Bought by
Rogers Josh and Rogers Chelsey
Current Estimated Value
Home Financials for this Owner
Home Financials are based on the most recent Mortgage that was taken out on this home.
Original Mortgage
$66,939
Outstanding Balance
$39,795
Interest Rate
6.3%
Mortgage Type
FHA
Estimated Equity
$93,405
Purchase Details
Closed on
Sep 30, 2005
Sold by
Cape James A
Bought by
Warren Sherri K
Home Financials for this Owner
Home Financials are based on the most recent Mortgage that was taken out on this home.
Original Mortgage
$59,000
Interest Rate
5.76%
Mortgage Type
New Conventional
Create a Home Valuation Report for This Property
The Home Valuation Report is an in-depth analysis detailing your home's value as well as a comparison with similar homes in the area
Home Values in the Area
Average Home Value in this Area
Purchase History
| Date | Buyer | Sale Price | Title Company |
|---|---|---|---|
| Rogers Josh | -- | None Available | |
| Warren Sherri K | -- | None Available |
Source: Public Records
Mortgage History
| Date | Status | Borrower | Loan Amount |
|---|---|---|---|
| Open | Rogers Josh | $66,939 | |
| Previous Owner | Warren Sherri K | $59,000 |
Source: Public Records
Tax History Compared to Growth
Tax History
| Year | Tax Paid | Tax Assessment Tax Assessment Total Assessment is a certain percentage of the fair market value that is determined by local assessors to be the total taxable value of land and additions on the property. | Land | Improvement |
|---|---|---|---|---|
| 2025 | $960 | $97,900 | -- | -- |
| 2024 | $960 | $89,000 | $7,500 | $86,026 |
| 2023 | $1,916 | $80,909 | $0 | $0 |
| 2022 | $1,756 | $78,725 | $7,500 | $71,225 |
| 2021 | $1,710 | $66,867 | $7,500 | $59,367 |
| 2020 | $1,647 | $64,070 | $7,500 | $56,570 |
| 2019 | $1,638 | $61,400 | $7,500 | $53,900 |
| 2018 | $2,147 | $80,479 | $7,500 | $72,979 |
| 2017 | $2,103 | $79,066 | $7,500 | $71,566 |
| 2016 | $2,103 | $79,066 | $7,500 | $71,566 |
| 2015 | $1,709 | $78,358 | $7,500 | $70,858 |
| 2014 | $1,709 | $78,542 | $7,500 | $71,042 |
Source: Public Records
Map
Nearby Homes