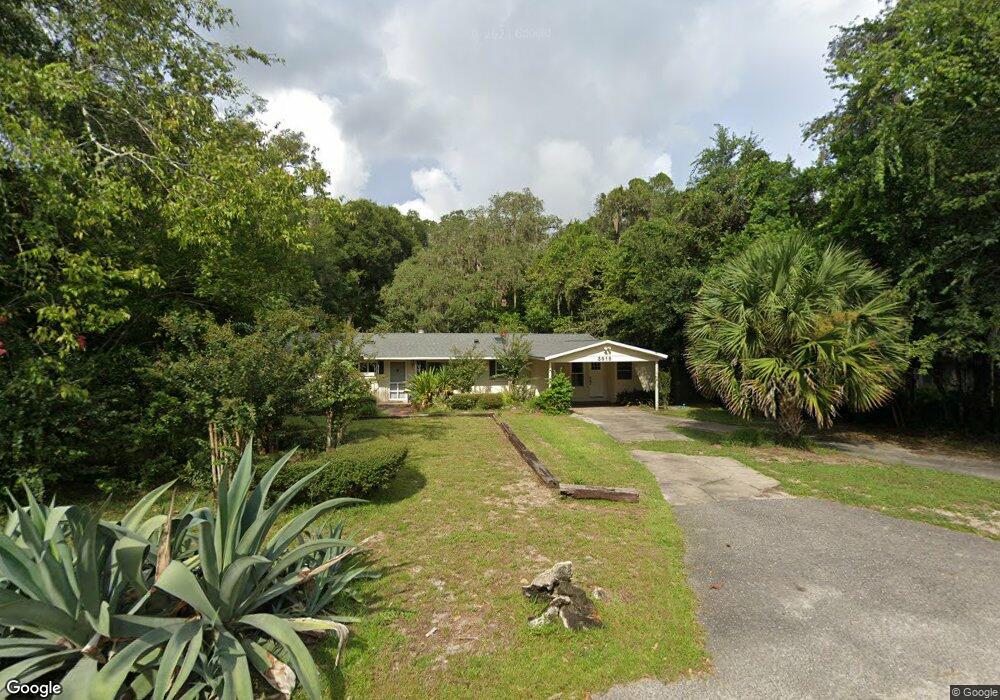
3816 SW 18th St Gainesville, FL 32608
Estimated Value: $262,000 - $339,000
3
Beds
2
Baths
1,664
Sq Ft
$183/Sq Ft
Est. Value
About This Home
This home is located at 3816 SW 18th St, Gainesville, FL 32608 and is currently estimated at $304,749, approximately $183 per square foot. 3816 SW 18th St is a home located in Alachua County with nearby schools including Idylwild Elementary School, Kanapaha Middle School, and Eastside High School.
Ownership History
Date
Name
Owned For
Owner Type
Purchase Details
Closed on
Feb 11, 2004
Sold by
Wubbel Eric A and Wubbel Eric
Bought by
Austin Valerie
Current Estimated Value
Purchase Details
Closed on
Nov 30, 2003
Bought by
Austin Valerie
Purchase Details
Closed on
May 29, 1997
Sold by
Lindley Steve and Lindley Joan E
Bought by
Wubbell Eric A and Austin Valerie A
Home Financials for this Owner
Home Financials are based on the most recent Mortgage that was taken out on this home.
Original Mortgage
$50,000
Interest Rate
8.18%
Purchase Details
Closed on
Jan 18, 1993
Bought by
Austin Valerie
Purchase Details
Closed on
Dec 23, 1992
Bought by
Austin Valerie
Purchase Details
Closed on
Jun 2, 1989
Bought by
Austin Valerie
Purchase Details
Closed on
Jun 1, 1987
Bought by
Austin Valerie
Purchase Details
Closed on
May 1, 1982
Bought by
Austin Valerie
Create a Home Valuation Report for This Property
The Home Valuation Report is an in-depth analysis detailing your home's value as well as a comparison with similar homes in the area
Purchase History
We collect this data history from publicly available records. To have your information removed, we recommend requesting removal directly through your county’s website.
| Date | Buyer | Sale Price | Title Company |
|---|---|---|---|
| Austin Valerie | $15,000 | -- | |
| Austin Valerie | $15,000 | -- | |
| Wubbell Eric A | $67,000 | -- | |
| Austin Valerie | $66,000 | -- | |
| Austin Valerie | $50,000 | -- | |
| Austin Valerie | $69,400 | -- | |
| Austin Valerie | $75,000 | -- | |
| Austin Valerie | $100 | -- |
Source: Public Records
Mortgage History
We collect this data history from publicly available records. To have your information removed, we recommend requesting removal directly through your county’s website.
| Date | Status | Borrower | Loan Amount |
|---|---|---|---|
| Previous Owner | Wubbell Eric A | $50,000 |
Source: Public Records
Tax History
| Year | Tax Paid | Tax Assessment Tax Assessment Total Assessment is a certain percentage of the fair market value that is determined by local assessors to be the total taxable value of land and additions on the property. | Land | Improvement |
|---|---|---|---|---|
| 2025 | $4,918 | $256,035 | $93,500 | $162,535 |
| 2024 | $3,992 | $256,035 | $93,500 | $162,535 |
| 2023 | $3,992 | $192,369 | $93,500 | $98,869 |
| 2022 | $3,701 | $180,586 | $93,500 | $87,086 |
| 2021 | $3,474 | $162,820 | $79,200 | $83,620 |
| 2020 | $3,086 | $129,863 | $41,800 | $88,063 |
| 2019 | $2,939 | $122,949 | $41,800 | $81,149 |
| 2018 | $2,633 | $109,700 | $38,500 | $71,200 |
| 2017 | $2,567 | $102,500 | $16,500 | $86,000 |
| 2016 | $2,586 | $104,700 | $0 | $0 |
| 2015 | $2,378 | $95,200 | $0 | $0 |
| 2014 | $2,259 | $89,800 | $0 | $0 |
| 2013 | -- | $91,400 | $16,500 | $74,900 |
Source: Public Records
Map
Nearby Homes
- 3907 SW 20th St
- 1830 SW Williston Rd
- 3773 SW 21st Dr
- 2163 SW 37th Ct
- 1602A SW Williston Rd
- 2164 SW 37th Ct
- 1925 SW 42nd Ave
- 2002 SW 43rd Ave
- 3729 SW 15
- 3926 SW 13th St
- 1800 SW 35th Place
- 4000 SW 23rd St Unit 5-106
- 4000 SW 23rd St Unit 3-108
- 4000 SW 23rd St Unit 3-302
- 4000 SW 23rd St Unit 4-303
- 4000 SW 23rd St Unit 2-303
- 4000 SW 23rd St Unit 1-108
- 4000 SW 23rd St Unit 1-105
- 5316 SW 13th St
- 2830 SW 14th Dr
- 3806 SW 18th St
- 3826 SW 18th St
- 3730 SW 18th St
- 3904 SW 18th St
- 3815 SW 18th St
- 3731 SW 19th St
- 3827 SW 19th St
- 3825 SW 19th St
- 3905 SW 18th St
- 3905 SW 19th St
- 1765 SW 37th Place
- 3720 SW 18th St
- 3914 SW 18th St
- 1762 SW 38th Place
- 3721 SW 19th St
- 1753 SW 38th Place
- 1753 SW 37th Place
- 3820 SW 19th St
- 3915 SW 18th St
- 3915 SW 19th St
Your Personal Tour Guide
Ask me questions while you tour the home.