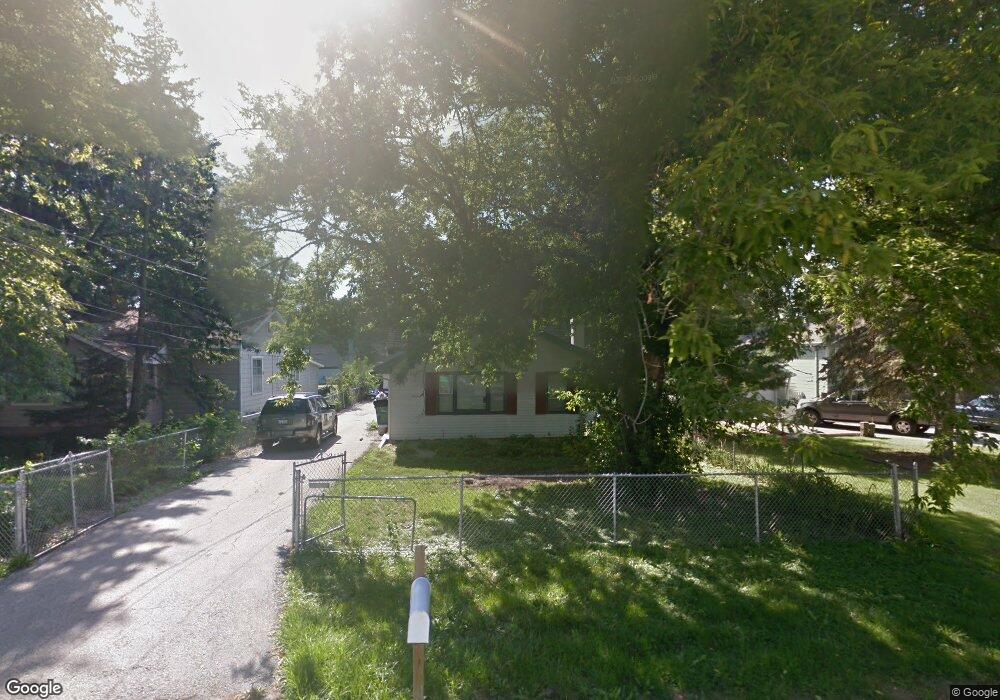
38160 N 4th Ave Spring Grove, IL 60081
Northeast Fox Lake NeighborhoodEstimated Value: $102,000 - $232,000
3
Beds
1
Bath
1,593
Sq Ft
$122/Sq Ft
Est. Value
About This Home
This home is located at 38160 N 4th Ave, Spring Grove, IL 60081 and is currently estimated at $193,783, approximately $121 per square foot. 38160 N 4th Ave is a home located in Lake County with nearby schools including Lotus Elementary School, Stanton Middle School, and Grant Community High School.
Ownership History
Date
Name
Owned For
Owner Type
Purchase Details
Closed on
Jul 6, 2018
Sold by
Murov Richard L and Murov Patricia
Bought by
Murov Justin and Murov Cory
Current Estimated Value
Home Financials for this Owner
Home Financials are based on the most recent Mortgage that was taken out on this home.
Original Mortgage
$127,300
Outstanding Balance
$110,324
Interest Rate
4.5%
Mortgage Type
New Conventional
Estimated Equity
$83,459
Purchase Details
Closed on
Jun 18, 2008
Sold by
Lasalle Bank Na
Bought by
Murov Richard L and Murov Patricia
Purchase Details
Closed on
Dec 20, 2007
Sold by
Lalond Daniel
Bought by
Lasalle Bank Na and Morgan Stanley Mortgage 2006-Ar
Purchase Details
Closed on
May 9, 2005
Sold by
Dubeck Harley
Bought by
Lalond Daniel and Lalond Elizabeth A
Home Financials for this Owner
Home Financials are based on the most recent Mortgage that was taken out on this home.
Original Mortgage
$117,000
Interest Rate
5.82%
Mortgage Type
Fannie Mae Freddie Mac
Create a Home Valuation Report for This Property
The Home Valuation Report is an in-depth analysis detailing your home's value as well as a comparison with similar homes in the area
Home Values in the Area
Average Home Value in this Area
Purchase History
| Date | Buyer | Sale Price | Title Company |
|---|---|---|---|
| Murov Justin | $134,000 | Chicago Title | |
| Murov Richard L | $115,000 | Attorneys Title Guaranty Fun | |
| Lasalle Bank Na | -- | Attorneys Title Guaranty Fun | |
| Lasalle Bank Na | -- | None Available | |
| Lalond Daniel | $130,000 | First American Title Ins Co |
Source: Public Records
Mortgage History
| Date | Status | Borrower | Loan Amount |
|---|---|---|---|
| Open | Murov Justin | $127,300 | |
| Previous Owner | Lalond Daniel | $117,000 |
Source: Public Records
Tax History
| Year | Tax Paid | Tax Assessment Tax Assessment Total Assessment is a certain percentage of the fair market value that is determined by local assessors to be the total taxable value of land and additions on the property. | Land | Improvement |
|---|---|---|---|---|
| 2024 | $4,049 | $56,475 | $2,852 | $53,623 |
| 2023 | $4,157 | $50,569 | $2,554 | $48,015 |
| 2022 | $4,157 | $50,164 | $3,179 | $46,985 |
| 2021 | $3,994 | $46,808 | $2,966 | $43,842 |
| 2020 | $3,932 | $45,515 | $2,884 | $42,631 |
| 2019 | $3,716 | $43,526 | $2,758 | $40,768 |
| 2018 | $3,751 | $42,490 | $2,792 | $39,698 |
| 2017 | $3,685 | $40,444 | $2,658 | $37,786 |
| 2016 | $3,943 | $39,031 | $2,565 | $36,466 |
| 2015 | $3,983 | $38,038 | $2,500 | $35,538 |
| 2014 | $3,699 | $38,729 | $3,729 | $35,000 |
| 2012 | $3,390 | $38,729 | $3,729 | $35,000 |
Source: Public Records
Map
Nearby Homes
- 38227 N 3rd Ave
- 27771 W Lake Shore Dr
- 38480 N 6th Ave
- 27580 W Stonegate Dr
- 171 Waltonian Terrace
- 28624 W Kendall Ave
- 79 Maude Ave Unit E
- 27726 Hill Dr
- 39175 NW End Dr
- Lots 11 & 12 W Ravine Dr
- Lots 8 & 9 W Ravine Dr
- 8226 Cinnamon Ln Unit H4D
- 8300 Reva Bay Ln Unit SLIP4
- 8300 Reva Bay Ln Unit SLIP5
- 39091 N Mound Ave
- 7105 Saint Tropez Ct Unit 297
- 38717 N Lake St
- 117 Nippersink Rd
- 8421 Canary Grass Ln Unit 8421
- 7205 Hastings Cir Unit 330
- 38152 N 4th Ave
- 38170 N 4th Ave
- 38178 N 4th Ave
- 38142 N 4th Ave
- 38177 N 5th Ave
- 27885 W Lake Shore Dr
- 38161 N 4th Ave
- 38151 N 4th Ave
- 38169 N 4th Ave
- 27879 W Lake Shore Dr
- 38189 N 5th Ave
- 38141 N 4th Ave
- 38133 N 4th Ave
- 38201 N 5th Ave
- 27901 W Lake Shore Dr
- 38123 N 4th Ave
- 38211 N 5th Ave
- 27873 W Lake Shore Dr
- 27909 W Lake Shore Dr
- 27867 W Lake Shore Dr
Your Personal Tour Guide
Ask me questions while you tour the home.