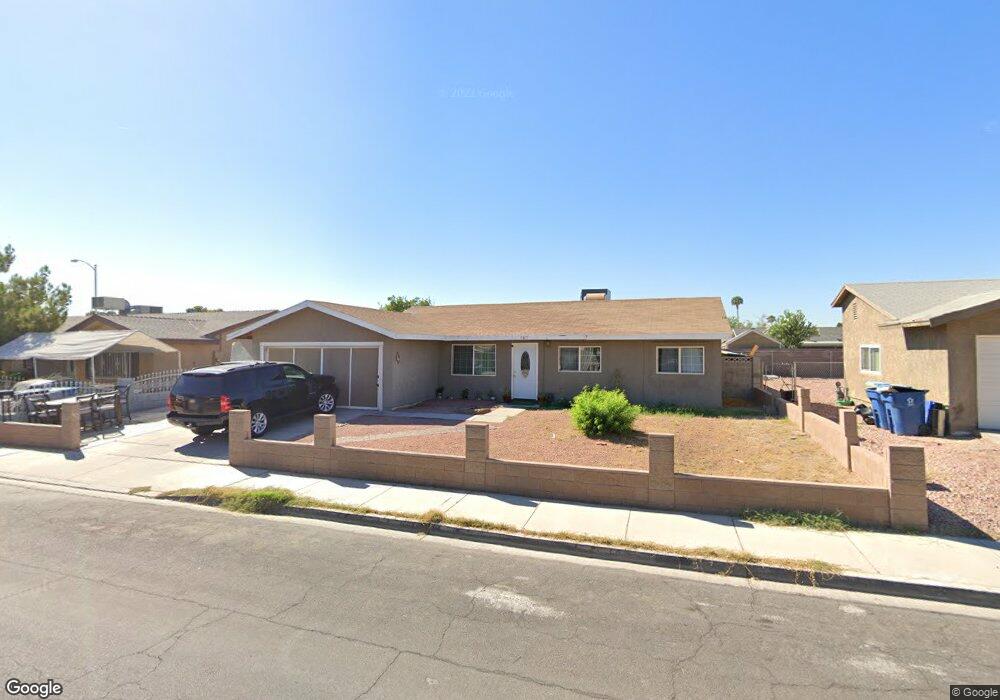
3817 Hudson Bay Ave Las Vegas, NV 89110
East Las Vegas NeighborhoodEstimated Value: $302,000 - $330,038
3
Beds
2
Baths
1,078
Sq Ft
$296/Sq Ft
Est. Value
About This Home
This home is located at 3817 Hudson Bay Ave, Las Vegas, NV 89110 and is currently estimated at $319,510, approximately $296 per square foot. 3817 Hudson Bay Ave is a home located in Clark County with nearby schools including Oran K Gragson Elementary School, Roy West Martin Middle School, and Desert Pines High School.
Ownership History
Date
Name
Owned For
Owner Type
Purchase Details
Closed on
Apr 2, 2010
Sold by
Us Bank National Association
Bought by
Desosa Jacqueline Espiricueta
Current Estimated Value
Purchase Details
Closed on
Jan 19, 2010
Sold by
Equihua Jose M and Equihua Ignacio
Bought by
Us Bank National Association
Purchase Details
Closed on
Apr 26, 2006
Sold by
Equihua Maria Natividad
Bought by
Equihua Jose M
Home Financials for this Owner
Home Financials are based on the most recent Mortgage that was taken out on this home.
Original Mortgage
$191,200
Interest Rate
6.29%
Mortgage Type
Fannie Mae Freddie Mac
Purchase Details
Closed on
Sep 17, 2001
Sold by
Mcdermott Geraldine G
Bought by
Mcdermott Geraldine G
Purchase Details
Closed on
Mar 17, 1994
Sold by
Mcdermott Barry L
Bought by
Mcdermott Geraldine C
Home Financials for this Owner
Home Financials are based on the most recent Mortgage that was taken out on this home.
Original Mortgage
$12,000
Interest Rate
7.15%
Create a Home Valuation Report for This Property
The Home Valuation Report is an in-depth analysis detailing your home's value as well as a comparison with similar homes in the area
Home Values in the Area
Average Home Value in this Area
Purchase History
| Date | Buyer | Sale Price | Title Company |
|---|---|---|---|
| Desosa Jacqueline Espiricueta | $65,500 | Ticor Title Las Vegas | |
| Us Bank National Association | $63,000 | Servicelink | |
| Equihua Jose M | -- | Land Title Of Nevada | |
| Equihua Jose M | $239,000 | Land Title Of Nevada | |
| Mcdermott Geraldine G | -- | Fidelity National Title | |
| Mcdermott Geraldine C | -- | Nevada Title Company |
Source: Public Records
Mortgage History
| Date | Status | Borrower | Loan Amount |
|---|---|---|---|
| Previous Owner | Equihua Jose M | $191,200 | |
| Previous Owner | Mcdermott Geraldine C | $12,000 |
Source: Public Records
Tax History Compared to Growth
Tax History
| Year | Tax Paid | Tax Assessment Tax Assessment Total Assessment is a certain percentage of the fair market value that is determined by local assessors to be the total taxable value of land and additions on the property. | Land | Improvement |
|---|---|---|---|---|
| 2025 | $931 | $44,234 | $25,550 | $18,684 |
| 2024 | $862 | $44,234 | $25,550 | $18,684 |
| 2023 | $862 | $47,416 | $28,700 | $18,716 |
| 2022 | $799 | $42,012 | $24,500 | $17,512 |
| 2021 | $740 | $39,111 | $22,050 | $17,061 |
| 2020 | $684 | $38,332 | $21,000 | $17,332 |
| 2019 | $641 | $34,203 | $16,800 | $17,403 |
| 2018 | $612 | $32,075 | $15,050 | $17,025 |
| 2017 | $1,034 | $31,531 | $14,000 | $17,531 |
| 2016 | $574 | $25,214 | $7,000 | $18,214 |
| 2015 | $572 | $22,057 | $5,600 | $16,457 |
| 2014 | $554 | $16,388 | $4,200 | $12,188 |
Source: Public Records
Map
Nearby Homes
- 432 Anchor St
- 3908 Montebello Ave
- 3700 Stewart Ave Unit 183
- 4028 Lighthouse Ave
- 4100 Montebello Ave
- 348 Century Dr
- 4117 Lighthouse Ave
- 4108 Montebello Ave
- 951 N Sandhill Rd
- 1405 N Sandhill Rd Unit 2
- 653 Lineshack Ln
- 3982 Saguaro Ln
- 3901 Stewart Ave Unit 40
- 3933 Harris Ave
- 4036 E Ogden Ave
- 4056 E Ogden Ave
- 3620 Park Oliver Dr
- 445 N Lamb Blvd Unit C
- 275 N Lamb Blvd Unit A
- 89 Vallejo Ave
- 3813 Hudson Bay Ave
- 3821 Hudson Bay Ave
- 3816 Lighthouse Ave
- 3812 Lighthouse Ave
- 3820 Lighthouse Ave
- 3809 Hudson Bay Ave
- 3816 Hudson Bay Ave
- 3812 Hudson Bay Ave
- 3820 Hudson Bay Ave
- 3808 Lighthouse Ave
- 3808 Hudson Bay Ave
- 3901 Hudson Bay Ave
- 3805 Hudson Bay Ave
- 3900 Lighthouse Ave
- 3804 Lighthouse Ave
- 3817 Lighthouse Ave
- 3817 Diamond Head Dr
- 3813 Lighthouse Ave
- 3821 Diamond Head Dr
- 3813 Diamond Head Dr