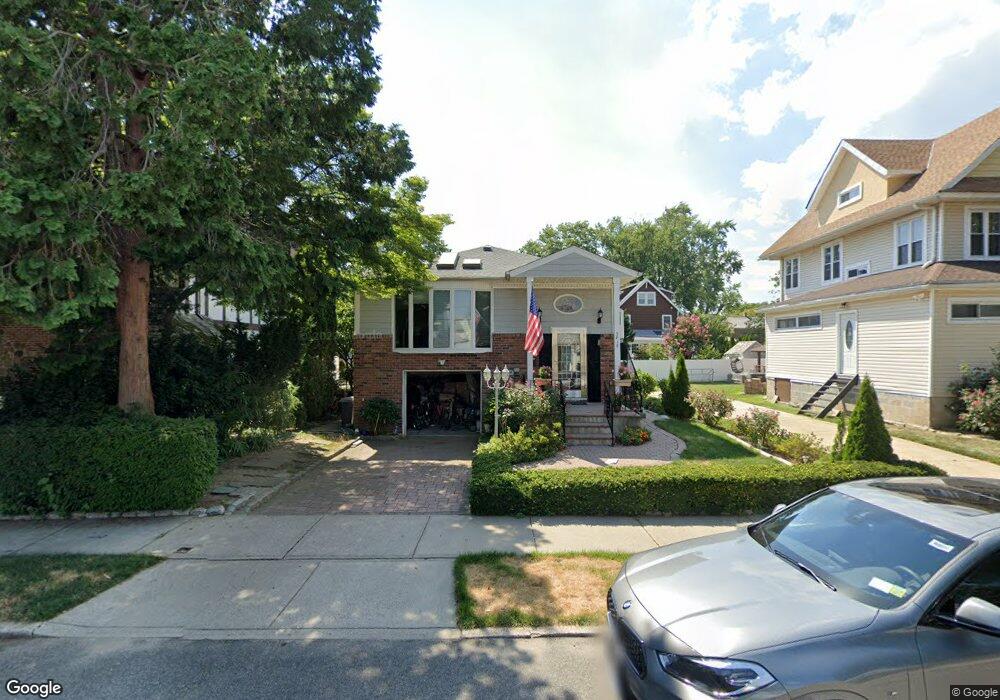
3818 218th St Bayside, NY 11361
Bayside NeighborhoodEstimated Value: $1,266,000 - $1,490,000
--
Bed
3
Baths
2,229
Sq Ft
$628/Sq Ft
Est. Value
About This Home
This home is located at 3818 218th St, Bayside, NY 11361 and is currently estimated at $1,399,815, approximately $628 per square foot. 3818 218th St is a home located in Queens County with nearby schools including P.S. 41 - Crocheron, M.S. 158 - Marie Curie, and Bayside High School.
Ownership History
Date
Name
Owned For
Owner Type
Purchase Details
Closed on
Jun 25, 2018
Sold by
Gorden Megan and Marren Sean
Bought by
Dumaual Albert V and Wang Stacy
Current Estimated Value
Home Financials for this Owner
Home Financials are based on the most recent Mortgage that was taken out on this home.
Original Mortgage
$555,000
Outstanding Balance
$481,057
Interest Rate
4.6%
Mortgage Type
Purchase Money Mortgage
Estimated Equity
$918,759
Purchase Details
Closed on
Jun 19, 2018
Sold by
Dumaual Albert and Hui-Leng Wang As Trustee
Bought by
Huang Liangxu and Li Xiao
Home Financials for this Owner
Home Financials are based on the most recent Mortgage that was taken out on this home.
Original Mortgage
$555,000
Outstanding Balance
$481,057
Interest Rate
4.6%
Mortgage Type
Purchase Money Mortgage
Estimated Equity
$918,759
Purchase Details
Closed on
Oct 25, 2017
Sold by
Wang I-Lun
Bought by
Wang Hui-Leng and Stacy Wang-Dumaual
Purchase Details
Closed on
May 14, 2014
Sold by
Boselli Phyllis M
Bought by
Dumaual Albert and Wang Huileng
Purchase Details
Closed on
Mar 20, 2002
Sold by
Bermont Louise and Bermont Trustee
Bought by
Boselli Phyllis M
Create a Home Valuation Report for This Property
The Home Valuation Report is an in-depth analysis detailing your home's value as well as a comparison with similar homes in the area
Home Values in the Area
Average Home Value in this Area
Purchase History
| Date | Buyer | Sale Price | Title Company |
|---|---|---|---|
| Dumaual Albert V | $330,000 | -- | |
| Huang Liangxu | $1,145,000 | -- | |
| Wang Hui-Leng | -- | -- | |
| Dumaual Albert | $860,000 | -- | |
| Boselli Phyllis M | -- | -- |
Source: Public Records
Mortgage History
| Date | Status | Borrower | Loan Amount |
|---|---|---|---|
| Open | Huang Liangxu | $555,000 |
Source: Public Records
Tax History Compared to Growth
Tax History
| Year | Tax Paid | Tax Assessment Tax Assessment Total Assessment is a certain percentage of the fair market value that is determined by local assessors to be the total taxable value of land and additions on the property. | Land | Improvement |
|---|---|---|---|---|
| 2025 | $11,746 | $63,473 | $12,814 | $50,659 |
| 2024 | $11,758 | $59,880 | $15,689 | $44,191 |
| 2023 | $12,237 | $62,328 | $12,561 | $49,767 |
| 2022 | $9,407 | $58,800 | $14,220 | $44,580 |
| 2021 | $9,946 | $58,380 | $14,220 | $44,160 |
| 2020 | $10,242 | $64,140 | $14,220 | $49,920 |
| 2019 | $9,411 | $68,700 | $14,220 | $54,480 |
| 2018 | $10,519 | $53,064 | $12,427 | $40,637 |
| 2017 | $10,704 | $52,507 | $13,424 | $39,083 |
| 2016 | $9,593 | $52,507 | $13,424 | $39,083 |
| 2014 | $5,755 | $46,800 | $15,780 | $31,020 |
Source: Public Records
Map
Nearby Homes
- 217-19 39th Ave
- 39-09 216th St
- 38-16 220th St
- 219-08 38th Ave
- 36-26 217th St
- 38-30 215th Place
- 36-26 216th St
- 38-33 215th St
- 36-24 216th St
- 21820 36th Ave
- 38-36 215th St
- 38-28 215th St
- 38-32 215th St
- 214-39 39th Ave
- 38-40 215th St
- 214-27 38th Ave
- 214-35 39th Ave
- 214-31 39th Ave
- 3628 215th St
- 3611 221st St
- 3818 218th St
- 3818 218th St
- 38-22 218th St
- 38-22 218th St Unit 2&3 FL
- 3824 218th St
- 3814 218th St
- 3828 218th St
- 3819 217th St
- 3811 217th St
- 3823 217th St
- 3806 218th St
- 21714 38th Ave
- 38-17 218th St
- 3827 217th St
- 21710 38th Ave
- 38-21 218th St Unit 2 floor
- 3817 218th St
- 3821 218th St
- 3815 218th St
- 3825 218th St