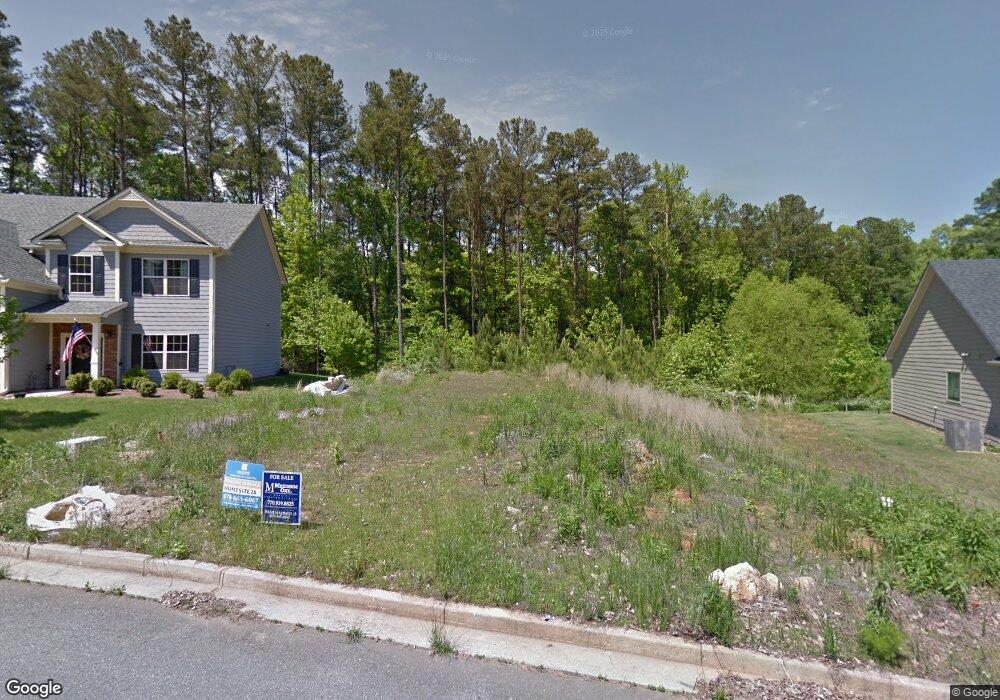
3818 Aspen Springs NW Unit 27 Kennesaw, GA 30144
Estimated Value: $458,977 - $503,000
4
Beds
3
Baths
2,945
Sq Ft
$163/Sq Ft
Est. Value
About This Home
This home is located at 3818 Aspen Springs NW Unit 27, Kennesaw, GA 30144 and is currently estimated at $479,244, approximately $162 per square foot. 3818 Aspen Springs NW Unit 27 is a home located in Cobb County with nearby schools including Lewis Elementary School, Awtrey Middle School, and North Cobb High School.
Ownership History
Date
Name
Owned For
Owner Type
Purchase Details
Closed on
Aug 22, 2019
Sold by
Abbott Jerome Lemont
Bought by
Abbott Jerome Lemont and Abbott Tomaro Tocania
Current Estimated Value
Home Financials for this Owner
Home Financials are based on the most recent Mortgage that was taken out on this home.
Original Mortgage
$287,900
Outstanding Balance
$252,147
Interest Rate
3.7%
Mortgage Type
New Conventional
Estimated Equity
$227,097
Purchase Details
Closed on
Jan 8, 2016
Sold by
Maloney Jennifer
Bought by
Maloney Jennifer and Maloney Brian
Home Financials for this Owner
Home Financials are based on the most recent Mortgage that was taken out on this home.
Original Mortgage
$194,565
Interest Rate
3.98%
Mortgage Type
New Conventional
Purchase Details
Closed on
Mar 29, 2012
Sold by
Suntrust Bank
Bought by
Brighton Custom Homes Ltd
Create a Home Valuation Report for This Property
The Home Valuation Report is an in-depth analysis detailing your home's value as well as a comparison with similar homes in the area
Home Values in the Area
Average Home Value in this Area
Purchase History
| Date | Buyer | Sale Price | Title Company |
|---|---|---|---|
| Abbott Jerome Lemont | -- | -- | |
| Abbott Jerome Lemont | $287,900 | -- | |
| Maloney Jennifer | -- | -- | |
| Maloney Jennifer | $228,900 | -- | |
| Brighton Custom Homes Ltd | $31,000 | -- |
Source: Public Records
Mortgage History
| Date | Status | Borrower | Loan Amount |
|---|---|---|---|
| Open | Abbott Jerome Lemont | $287,900 | |
| Closed | Abbott Jerome Lemont | $287,900 | |
| Previous Owner | Maloney Jennifer | $194,565 |
Source: Public Records
Tax History Compared to Growth
Tax History
| Year | Tax Paid | Tax Assessment Tax Assessment Total Assessment is a certain percentage of the fair market value that is determined by local assessors to be the total taxable value of land and additions on the property. | Land | Improvement |
|---|---|---|---|---|
| 2025 | $4,906 | $199,844 | $40,000 | $159,844 |
| 2024 | $4,910 | $199,844 | $40,000 | $159,844 |
| 2023 | $3,564 | $162,812 | $24,000 | $138,812 |
| 2022 | $3,365 | $127,528 | $24,000 | $103,528 |
| 2021 | $3,365 | $127,528 | $24,000 | $103,528 |
| 2020 | $3,957 | $100,076 | $24,000 | $76,076 |
| 2019 | $2,694 | $100,076 | $24,000 | $76,076 |
| 2018 | $2,694 | $100,076 | $24,000 | $76,076 |
| 2017 | $2,376 | $91,560 | $17,920 | $73,640 |
| 2016 | $2,639 | $91,792 | $18,000 | $73,792 |
| 2015 | $354 | $12,000 | $12,000 | $0 |
| 2014 | $452 | $15,200 | $0 | $0 |
Source: Public Records
Map
Nearby Homes
- 3902 Brave Trail NW
- 3856 Nowlin Rd NW
- 3906 Denbury Ct NW
- 3610 Darcy Ct NW
- 3552 Vicky Cir NW
- 3611 Silver Brooke Ln NW
- 3509 Vicky Cir NW
- 3485 Clubside Ln NW
- 3516 Nowlin Rd NW
- 3430 Town Square Dr NW Unit 1
- 3430 Town Square Dr NW
- 4146 McEver Park Dr
- 3104 Redwood Ln NW
- 3182 Mckinley Ct
- 3430 Palm Cir NW
- 3502 Clear Creek Crossing NW
- 3335 Quick Water Landing NW Unit 2
- 3789 Seattle Place NW
- 3818 Aspen Springs NW
- 3818 Aspen Springs Unit 27
- 3820 Aspen Springs NW
- 3816 Aspen Springs NW Unit 26
- 3822 Aspen Springs NW Unit 29
- 3822 Aspen Springs NW
- 3815 Aspen Springs
- 3817 Aspen Springs NW Unit 17
- 3817 Aspen Springs NW
- 3506 Faulkland Ct NW
- 3824 Aspen Springs
- 3824 Aspen Springs Unit 30
- 3672 Old 41 Hwy NW
- 3502 Faulkland Ct NW
- 3826 Aspen Springs NW
- 3810 Aspen Springs NW
- 3810 Aspen Springs NW Unit 25
- 3827 Aspen Springs NW
- 3828 Aspen Springs NW
- 3500 Faulkland Ct NW Unit 30