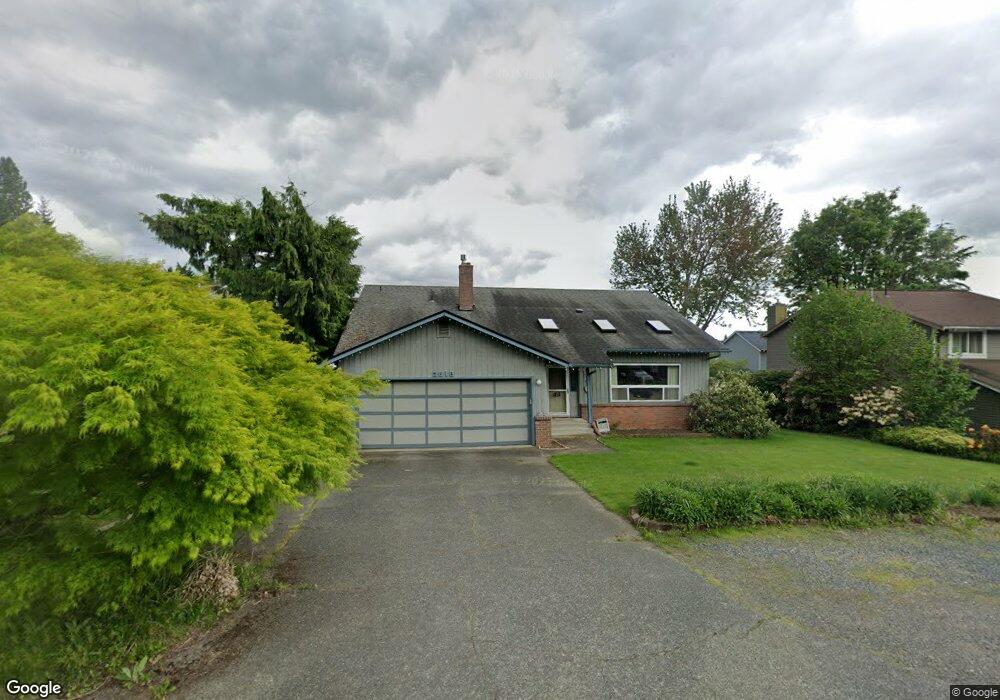
3818 Gala Loop Bellingham, WA 98226
Estimated Value: $725,327 - $876,000
3
Beds
2
Baths
2,182
Sq Ft
$355/Sq Ft
Est. Value
About This Home
This home is located at 3818 Gala Loop, Bellingham, WA 98226 and is currently estimated at $774,082, approximately $354 per square foot. 3818 Gala Loop is a home located in Whatcom County with nearby schools including Northern Heights Elementary School, Shuksan Middle School, and Squalicum High School.
Create a Home Valuation Report for This Property
The Home Valuation Report is an in-depth analysis detailing your home's value as well as a comparison with similar homes in the area
Tax History
| Year | Tax Paid | Tax Assessment Tax Assessment Total Assessment is a certain percentage of the fair market value that is determined by local assessors to be the total taxable value of land and additions on the property. | Land | Improvement |
|---|---|---|---|---|
| 2025 | $5,939 | $663,657 | $234,944 | $428,713 |
| 2024 | $5,811 | $644,313 | $228,096 | $416,217 |
| 2023 | $5,811 | $672,651 | $238,128 | $434,523 |
| 2022 | $4,638 | $546,870 | $193,600 | $353,270 |
| 2021 | $4,516 | $451,959 | $160,000 | $291,959 |
| 2020 | $4,336 | $413,497 | $143,308 | $270,189 |
| 2019 | $3,795 | $386,339 | $133,998 | $252,341 |
| 2018 | $3,934 | $346,521 | $120,198 | $226,323 |
| 2017 | $3,426 | $306,605 | $106,352 | $200,253 |
| 2016 | $3,164 | $278,651 | $96,784 | $181,867 |
| 2015 | $3,335 | $265,454 | $92,000 | $173,454 |
| 2014 | -- | $272,086 | $87,720 | $184,366 |
| 2013 | -- | $260,545 | $85,000 | $175,545 |
Source: Public Records
Map
Nearby Homes
- 1636 Amy Ct
- 3717 Toad Lake Rd
- 1494 Greenville Dr
- 3785 Greenville Place
- 1464 Greenville Dr
- 3718 Greenville St
- 2933 Toad Lake Rd
- 3575 S Grace Ln Unit 6
- 1367 Roma Rd
- 4055 Springland Ct
- 4121 Malachite Dr
- 1693 Pebble Beach Trail
- 4144 Malachite Dr
- 711 Poplar Dr
- 4168 Bray Way
- 4200 Jimi Hendrix Way
- 3618 Westhills Place
- 4220 Brays Way
- 3649 Westhills Place
- 2918 Sylvan St Unit 103
Your Personal Tour Guide
Ask me questions while you tour the home.