M
Seller's Agent in 2025
Molly Zuckerberg
Sibcy Cline
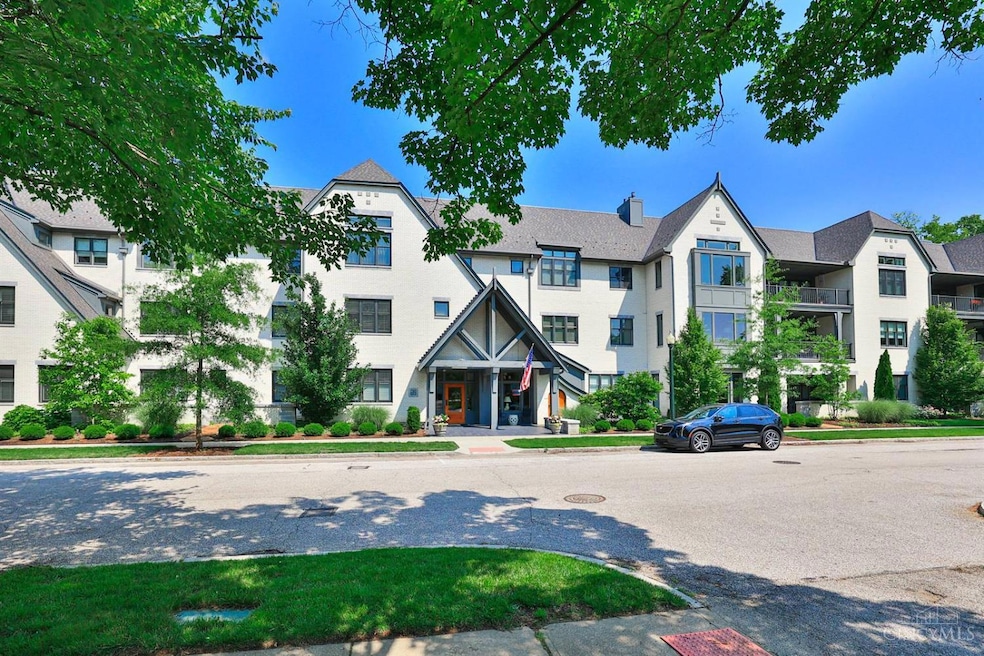


Experience luxury living in this beautiful condo filled with natural light and upscale finishes throughout! The open dining area & great room feature vaulted ceilings, gas fireplace, crown molding, and custom built-in cabinetry. Kitchen is perfect for cooking or entertaining - it includes spacious island, premium Thermador refrigerator, glass front display cabinets w accent lighting and lots more. The spacious primary suite is complete with 2 walk-in closets, and a stunning full bath featuring a double vanity. Enjoy quiet mornings on the private balcony or take a short stroll to shops and restaurants. Don't miss the gem!
Last Agent to Sell the Property
Sibcy Cline, Inc. License #2016005076 Listed on: 06/11/2025

| Date | Type | Sale Price | Title Company |
|---|---|---|---|
| Executors Deed | $1,501,000 | None Listed On Document | |
| Executors Deed | $1,501,000 | None Listed On Document | |
| Warranty Deed | $1,075,000 | None Available |
| Date | Event | Price | Change | Sq Ft Price |
|---|---|---|---|---|
| 06/27/2025 06/27/25 | Sold | $1,501,000 | +15.6% | $687 / Sq Ft |
| 06/14/2025 06/14/25 | Pending | -- | -- | -- |
| 06/11/2025 06/11/25 | For Sale | $1,299,000 | +36.7% | $595 / Sq Ft |
| 03/14/2025 03/14/25 | Sold | $950,000 | -5.0% | $545 / Sq Ft |
| 02/19/2025 02/19/25 | Off Market | $999,900 | -- | -- |
| 02/16/2025 02/16/25 | Pending | -- | -- | -- |
| 02/13/2025 02/13/25 | Price Changed | $999,900 | -4.8% | $574 / Sq Ft |
| 01/29/2025 01/29/25 | For Sale | $1,050,000 | -16.0% | $603 / Sq Ft |
| 09/09/2024 09/09/24 | Sold | $1,250,000 | 0.0% | $626 / Sq Ft |
| 04/15/2024 04/15/24 | Pending | -- | -- | -- |
| 01/15/2024 01/15/24 | For Sale | $1,250,000 | +28.2% | $626 / Sq Ft |
| 03/17/2021 03/17/21 | Off Market | $975,000 | -- | -- |
| 12/14/2020 12/14/20 | Sold | $975,000 | +22.6% | $488 / Sq Ft |
| 11/30/2020 11/30/20 | Pending | -- | -- | -- |
| 05/03/2020 05/03/20 | Off Market | $795,000 | -- | -- |
| 04/30/2020 04/30/20 | Off Market | $1,100,000 | -- | -- |
| 02/03/2020 02/03/20 | Sold | $795,000 | -27.7% | $398 / Sq Ft |
| 01/31/2020 01/31/20 | Sold | $1,100,000 | +4.8% | $551 / Sq Ft |
| 01/24/2020 01/24/20 | Pending | -- | -- | -- |
| 12/18/2019 12/18/19 | Pending | -- | -- | -- |
| 12/15/2019 12/15/19 | Off Market | $1,050,000 | -- | -- |
| 10/28/2019 10/28/19 | Off Market | $950,000 | -- | -- |
| 10/24/2019 10/24/19 | Off Market | $1,125,000 | -- | -- |
| 09/24/2019 09/24/19 | Off Market | $1,125,000 | -- | -- |
| 09/19/2019 09/19/19 | Off Market | $1,512,486 | -- | -- |
| 09/16/2019 09/16/19 | Sold | $1,050,000 | -43.9% | $526 / Sq Ft |
| 09/10/2019 09/10/19 | Off Market | $1,871,576 | -- | -- |
| 09/10/2019 09/10/19 | Off Market | $1,215,074 | -- | -- |
| 09/10/2019 09/10/19 | Off Market | $1,042,005 | -- | -- |
| 09/05/2019 09/05/19 | Off Market | $1,075,000 | -- | -- |
| 08/26/2019 08/26/19 | Off Market | $1,205,311 | -- | -- |
| 08/22/2019 08/22/19 | Off Market | $1,357,398 | -- | -- |
| 08/21/2019 08/21/19 | Off Market | $1,263,364 | -- | -- |
| 08/21/2019 08/21/19 | Off Market | $1,194,574 | -- | -- |
| 08/19/2019 08/19/19 | Off Market | $1,613,174 | -- | -- |
| 08/05/2019 08/05/19 | Price Changed | $990,000 | +4.2% | $496 / Sq Ft |
| 07/31/2019 07/31/19 | Pending | -- | -- | -- |
| 07/30/2019 07/30/19 | Sold | $950,000 | -15.6% | $476 / Sq Ft |
| 07/26/2019 07/26/19 | Sold | $1,125,000 | 0.0% | $564 / Sq Ft |
| 06/26/2019 06/26/19 | Sold | $1,125,000 | -25.6% | $564 / Sq Ft |
| 06/21/2019 06/21/19 | Sold | $1,512,486 | +40.7% | $758 / Sq Ft |
| 06/17/2019 06/17/19 | Pending | -- | -- | -- |
| 06/07/2019 06/07/19 | Sold | $1,075,000 | +3.2% | $539 / Sq Ft |
| 06/07/2019 06/07/19 | Pending | -- | -- | -- |
| 06/04/2019 06/04/19 | Sold | $1,042,005 | -14.2% | $522 / Sq Ft |
| 06/03/2019 06/03/19 | Sold | $1,215,074 | -35.1% | $609 / Sq Ft |
| 06/03/2019 06/03/19 | Sold | $1,871,576 | +55.3% | $938 / Sq Ft |
| 05/29/2019 05/29/19 | Pending | -- | -- | -- |
| 05/28/2019 05/28/19 | Sold | $1,205,311 | +0.9% | $604 / Sq Ft |
| 05/23/2019 05/23/19 | Sold | $1,194,574 | -12.0% | $598 / Sq Ft |
| 05/23/2019 05/23/19 | Sold | $1,357,398 | -15.9% | $680 / Sq Ft |
| 05/20/2019 05/20/19 | Sold | $1,613,174 | +27.7% | $808 / Sq Ft |
| 05/16/2019 05/16/19 | Sold | $1,263,364 | +58.9% | $633 / Sq Ft |
| 03/04/2019 03/04/19 | Price Changed | $795,000 | -16.3% | $398 / Sq Ft |
| 03/04/2019 03/04/19 | Price Changed | $950,000 | -20.8% | $476 / Sq Ft |
| 02/05/2019 02/05/19 | Pending | -- | -- | -- |
| 05/25/2018 05/25/18 | Pending | -- | -- | -- |
| 04/17/2018 04/17/18 | Pending | -- | -- | -- |
| 03/20/2018 03/20/18 | Pending | -- | -- | -- |
| 01/23/2018 01/23/18 | For Sale | $1,200,000 | +14.3% | $601 / Sq Ft |
| 01/05/2018 01/05/18 | Pending | -- | -- | -- |
| 01/05/2018 01/05/18 | Pending | -- | -- | -- |
| 10/06/2017 10/06/17 | For Sale | $1,050,000 | -2.3% | $526 / Sq Ft |
| 10/06/2017 10/06/17 | For Sale | $1,075,000 | +19.4% | $539 / Sq Ft |
| 10/06/2017 10/06/17 | For Sale | $900,000 | -7.7% | $451 / Sq Ft |
| 10/05/2017 10/05/17 | For Sale | $975,000 | -17.0% | $488 / Sq Ft |
| 09/27/2017 09/27/17 | For Sale | $1,175,000 | 0.0% | $589 / Sq Ft |
| 09/27/2017 09/27/17 | Pending | -- | -- | -- |
| 09/26/2017 09/26/17 | For Sale | $1,175,000 | +4.4% | $589 / Sq Ft |
| 09/25/2017 09/25/17 | For Sale | $1,125,000 | 0.0% | $564 / Sq Ft |
| 09/25/2017 09/25/17 | For Sale | $1,125,000 | -6.3% | $564 / Sq Ft |
| 09/21/2017 09/21/17 | For Sale | $1,200,000 | +6.7% | $601 / Sq Ft |
| 09/21/2017 09/21/17 | For Sale | $1,125,000 | -10.0% | $564 / Sq Ft |
| 09/20/2017 09/20/17 | For Sale | $1,250,000 | +28.2% | $626 / Sq Ft |
| 09/18/2017 09/18/17 | Pending | -- | -- | -- |
| 09/18/2017 09/18/17 | For Sale | $975,000 | +25.8% | $488 / Sq Ft |
| 09/18/2017 09/18/17 | Pending | -- | -- | -- |
| 09/14/2017 09/14/17 | Pending | -- | -- | -- |
| 09/14/2017 09/14/17 | Pending | -- | -- | -- |
| 09/14/2017 09/14/17 | For Sale | $775,000 | -48.3% | $388 / Sq Ft |
| 09/14/2017 09/14/17 | For Sale | $1,500,000 | 0.0% | $752 / Sq Ft |
| 09/14/2017 09/14/17 | For Sale | $1,500,000 | +36.4% | $752 / Sq Ft |
| 09/14/2017 09/14/17 | For Sale | $1,100,000 | -29.0% | $551 / Sq Ft |
| 09/14/2017 09/14/17 | For Sale | $1,550,000 | -- | $777 / Sq Ft |
| Year | Tax Paid | Tax Assessment Tax Assessment Total Assessment is a certain percentage of the fair market value that is determined by local assessors to be the total taxable value of land and additions on the property. | Land | Improvement |
|---|---|---|---|---|
| 2024 | $15,085 | $362,814 | $55,125 | $307,689 |
| 2023 | $13,721 | $362,814 | $55,125 | $307,689 |
| 2022 | $16,094 | $376,250 | $39,900 | $336,350 |
| 2021 | $16,012 | $376,250 | $39,900 | $336,350 |
| 2020 | $15,798 | $376,250 | $39,900 | $336,350 |
| 2019 | $0 | $0 | $0 | $0 |
M
Seller's Agent in 2025
Molly Zuckerberg
Sibcy Cline
D
Seller's Agent in 2025
Drew Homan
Coldwell Banker Realty
I
Seller Co-Listing Agent in 2025
Ingrid Likes
Coldwell Banker Realty
C
Buyer's Agent in 2025
Ceci David
Sibcy Cline
N
Buyer's Agent in 2025
Non Member
NonMember Firm
P
Seller's Agent in 2024
Patti Sibcy
Sibcy Cline
Source: MLS of Greater Cincinnati (CincyMLS)
MLS Number: 1844083
APN: 527-0020-0691
Disclaimer: Certain information contained herein is derived from information provided by parties other than Homes.com. All information provided is deemed reliable, but is not guaranteed to be accurate and should be independently verified.
![]() The data relating to real estate for sale on this website comes in part from the Broker Reciprocity programs of the MLS of Greater Cincinnati, Inc.. Those listings held by brokerage firms other than Ten-X are marked with the Broker Reciprocity logo and house icon. The properties displayed may not be all of the properties available through Broker Reciprocity.
The data relating to real estate for sale on this website comes in part from the Broker Reciprocity programs of the MLS of Greater Cincinnati, Inc.. Those listings held by brokerage firms other than Ten-X are marked with the Broker Reciprocity logo and house icon. The properties displayed may not be all of the properties available through Broker Reciprocity.
IDX information is provided exclusively for personal, non-commercial use, and may not be used for any purpose other than to identify prospective properties consumers may be interested in purchasing.
Information is deemed reliable but not guaranteed.
Ten-X does not display the entire Cincinnati MLS Broker Reciprocity™ database on this web site. The listings of some real estate brokerage firms have been excluded.
Copyright 2025, MLS of Greater Cincinnati, Inc. All rights reserved