Estimated Value: $422,256 - $468,000
3
Beds
1
Bath
1,506
Sq Ft
$297/Sq Ft
Est. Value
About This Home
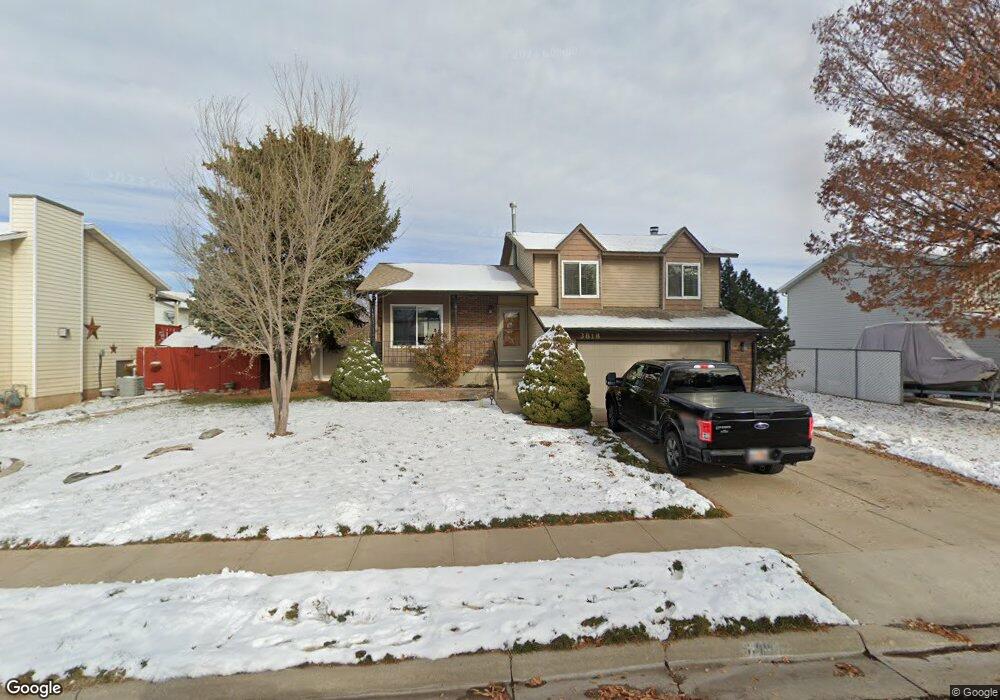
This home is located at 3818 W 5800 S, Roy, UT 84067 and is currently estimated at $446,814, approximately $296 per square foot. 3818 W 5800 S is a home located in Weber County with nearby schools including Midland School, Roy Junior High School, and Roy High School.
Ownership History
Date
Name
Owned For
Owner Type
Purchase Details
Closed on
Mar 18, 2013
Sold by
Foxley Brett R
Bought by
Foxley Brett R and Fosmark Colby Diane
Current Estimated Value
Purchase Details
Closed on
Nov 26, 2008
Sold by
Foxley Pahmela Diane
Bought by
Foxley Brett R
Home Financials for this Owner
Home Financials are based on the most recent Mortgage that was taken out on this home.
Original Mortgage
$20,000
Interest Rate
6.47%
Mortgage Type
New Conventional
Purchase Details
Closed on
May 23, 2003
Sold by
Foxley Pahmela D
Bought by
Foxley Brett R
Home Financials for this Owner
Home Financials are based on the most recent Mortgage that was taken out on this home.
Original Mortgage
$61,774
Interest Rate
5.05%
Mortgage Type
FHA
Create a Home Valuation Report for This Property
The Home Valuation Report is an in-depth analysis detailing your home's value as well as a comparison with similar homes in the area
Home Values in the Area
Average Home Value in this Area
Purchase History
| Date | Buyer | Sale Price | Title Company |
|---|---|---|---|
| Foxley Brett R | -- | Mountain View Title Ogden | |
| Foxley Brett R | -- | Inwest Title Ogden | |
| Foxley Brett R | -- | Bonneville Title |
Source: Public Records
Mortgage History
| Date | Status | Borrower | Loan Amount |
|---|---|---|---|
| Closed | Foxley Brett R | $20,000 | |
| Closed | Foxley Brett R | $61,774 |
Source: Public Records
Tax History Compared to Growth
Tax History
| Year | Tax Paid | Tax Assessment Tax Assessment Total Assessment is a certain percentage of the fair market value that is determined by local assessors to be the total taxable value of land and additions on the property. | Land | Improvement |
|---|---|---|---|---|
| 2025 | $2,622 | $415,698 | $141,064 | $274,634 |
| 2024 | $2,561 | $224,949 | $77,585 | $147,364 |
| 2023 | $2,576 | $227,700 | $72,555 | $155,145 |
| 2022 | $2,401 | $216,700 | $59,551 | $157,149 |
| 2021 | $2,070 | $308,000 | $78,213 | $229,787 |
| 2020 | $1,921 | $262,000 | $78,213 | $183,787 |
| 2019 | $1,813 | $232,000 | $48,484 | $183,516 |
| 2018 | $1,670 | $200,000 | $45,573 | $154,427 |
| 2017 | $1,538 | $171,000 | $45,573 | $125,427 |
| 2016 | $1,518 | $91,358 | $22,454 | $68,904 |
| 2015 | $1,360 | $83,163 | $22,454 | $60,709 |
| 2014 | $1,317 | $79,276 | $22,454 | $56,822 |
Source: Public Records
Map
Nearby Homes