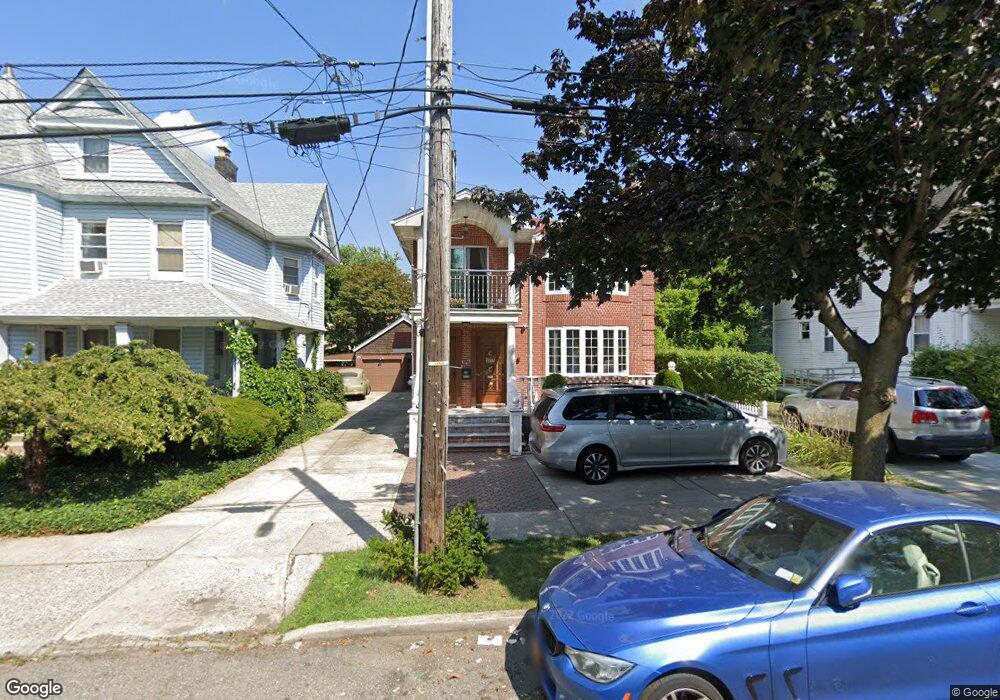
3819 214th Place Bayside, NY 11361
Bayside NeighborhoodEstimated Value: $1,179,887 - $1,698,000
Studio
--
Bath
1,980
Sq Ft
$715/Sq Ft
Est. Value
About This Home
This home is located at 3819 214th Place, Bayside, NY 11361 and is currently estimated at $1,415,296, approximately $714 per square foot. 3819 214th Place is a home located in Queens County with nearby schools including P.S. 41 - Crocheron, M.S. 158 - Marie Curie, and Bayside High School.
Ownership History
Date
Name
Owned For
Owner Type
Purchase Details
Closed on
Nov 9, 2011
Sold by
Zhang Xiao Kai
Bought by
Chen Xiu Zhen
Current Estimated Value
Home Financials for this Owner
Home Financials are based on the most recent Mortgage that was taken out on this home.
Original Mortgage
$597,000
Outstanding Balance
$407,177
Interest Rate
4.1%
Mortgage Type
Commercial
Estimated Equity
$1,008,119
Purchase Details
Closed on
Aug 3, 2009
Sold by
Mcgee John and Mcgee Mary Ellen
Bought by
Zhang Xiao Kai
Home Financials for this Owner
Home Financials are based on the most recent Mortgage that was taken out on this home.
Original Mortgage
$400,000
Interest Rate
5.36%
Purchase Details
Closed on
Feb 10, 1995
Sold by
Mcgee James F and Mcgee Ann M
Bought by
Mcgee Mary Ellen and Mcgee Thomas
Create a Home Valuation Report for This Property
The Home Valuation Report is an in-depth analysis detailing your home's value as well as a comparison with similar homes in the area
Home Values in the Area
Average Home Value in this Area
Purchase History
| Date | Buyer | Sale Price | Title Company |
|---|---|---|---|
| Chen Xiu Zhen | $995,000 | -- | |
| Chen Xiu Zhen | $995,000 | -- | |
| Zhang Xiao Kai | $565,000 | -- | |
| Zhang Xiao Kai | $565,000 | -- | |
| Mcgee Mary Ellen | -- | Chicago Title Insurance Co | |
| Mcgee Mary Ellen | -- | Chicago Title Insurance Co |
Source: Public Records
Mortgage History
| Date | Status | Borrower | Loan Amount |
|---|---|---|---|
| Open | Chen Xiu Zhen | $597,000 | |
| Closed | Chen Xiu Zhen | $597,000 | |
| Previous Owner | Zhang Xiao Kai | $400,000 |
Source: Public Records
Tax History
| Year | Tax Paid | Tax Assessment Tax Assessment Total Assessment is a certain percentage of the fair market value that is determined by local assessors to be the total taxable value of land and additions on the property. | Land | Improvement |
|---|---|---|---|---|
| 2025 | $11,129 | $58,732 | $9,744 | $48,988 |
| 2024 | $11,129 | $55,408 | $9,123 | $46,285 |
| 2023 | $10,499 | $52,272 | $8,779 | $43,493 |
| 2022 | $10,435 | $73,140 | $13,020 | $60,120 |
| 2021 | $10,918 | $67,320 | $13,020 | $54,300 |
| 2020 | $10,360 | $64,320 | $13,020 | $51,300 |
| 2019 | $9,659 | $63,660 | $13,020 | $50,640 |
| 2018 | $8,880 | $43,560 | $7,623 | $35,937 |
| 2017 | $8,880 | $43,560 | $9,616 | $33,944 |
| 2016 | $8,643 | $43,560 | $9,616 | $33,944 |
| 2015 | $4,917 | $40,786 | $11,377 | $29,409 |
| 2014 | $4,917 | $38,478 | $12,773 | $25,705 |
Source: Public Records
Map
Nearby Homes
- 214-35 39th Ave
- 214-31 39th Ave
- 214-39 39th Ave
- 38-40 215th St
- 38-33 215th St
- 3832 215th Place
- 38-36 215th St
- 38-24 215th St
- 38-28 215th St
- 38-32 215th St
- 38-30 215th Place
- 3628 215th St
- 39-09 216th St
- 39-26 213th St
- 38-24 213th St
- 36-26 216th St
- 47-22 215 Place Unit 2C
- 40-29 216th St
- 36-30 213th St Unit 1A
- 36-26 217th St
- 3815 214th Place
- 3827 214th Place
- 3807 214th Place
- 3818 215th St
- 38-18 215th St Unit 1C
- 38-18 215th St
- 3814 215th St
- 38-26 214th Place Unit 2
- 38-10 215th St Unit 2
- 38-10 215th St
- 3810 215th St
- 3803 214th Place
- 3818 214th Place
- 3826 214th Place
- 3812 214th Place
- 38-30 214th Place
- 21443 39th Ave
- 3830 214th Place
- 214-43 39th Ave
- 21443 39th Ave
Your Personal Tour Guide
Ask me questions while you tour the home.